Table of Contents

Introduction

The Climate Data Store (CDS) is the cornerstone infrastructure which supports the implementation of the Copernicus Climate Change Service (C3S). It enables the provision of Essential Climate Variables (ECVs), climate analyses, reanalyses, projections and indicators at temporal and spatial scales relevant to adaptation and mitigation strategies for various sectoral and societal benefit areas.

The CDS is designed as a distributed system which provides improved access to local and remote datasets via a powerful service-oriented architecture.

The CDS offers seamless web-based and API-based search and retrieve facilities to access climate data and information. In addition, the CDS also provides a generic software toolbox that allows users to develop web-based applications that make use of the datasets available in the CDS.

The data provided by the CDS are free and open data, subject to the user agreeing to the relevant dataset licence(s). For further details, please see this article from the ECMWF Newsletter 151 and this  C3S User Learning Services video.

How the CDS works

The CDS provides a Catalogue which lists C3S data and products, including observations, reanalyses, seasonal forecasts and climate projections. Users can search through the catalogue, and can filter the entries by means of both faceted search (Product type, Variable domain, Spatial coverage, or Temporal coverage) and textual search. 

Users can request data from the CDS using a variety of methods:

  • the CDS web interface
  • the CDS Application Programming Interface (API)
  • the CDS Toolbox

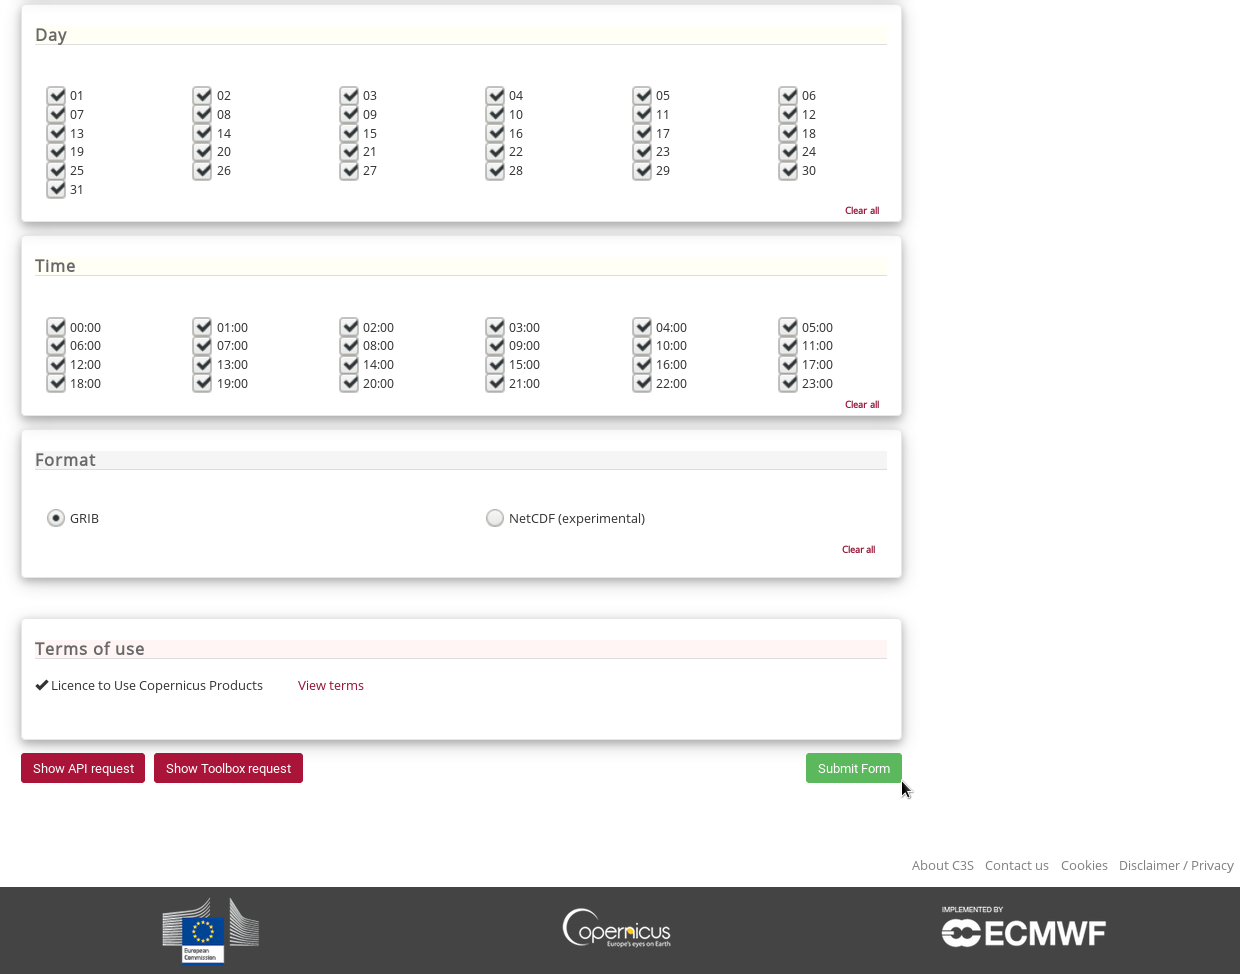
1) The CDS web interface is an interactive system: the user fills a web form to construct their valid query and can then choose between three options:

  • submit the form and download the result of the query;
  • show the query as an API request;
  • show the query as a toolbox request (if the dataset is supported by the Toolbox).

Please make sure that you select all the mandatory fields before submitting a request.

This is shown in the following figures:

Figure 1 Web interfaceFigure 2 Request options on the web interface


2) The CDS API is a service providing programmatic access to CDS data in Python (using the CDS API client). Users need to have a CDS account to use it with their related CDS API credentials. For a full description and some useful examples, please see How to use the CDS API

If users have more than one CDS API key (e.g. you also have a Atmosphere Data Store (ADS) account), you have to pass credentials in explicitly and the following method can be used:

import cdsapi
import yaml

with open('/path/to/ads/cdsapirc', 'r') as f:
        credentials = yaml.safe_load(f)
c = cdsapi.Client(url=credentials['url'], key=credentials['key'])

c.retrieve("dataset-short-name", 
           {... sub-selection request ...}, 
           "target-file")

We strongly suggest to construct CDS API requests by using the CDS web interface of the relevant dataset and using the 'Show API request' button to get the code.

For the most common CDS API issues, please see Common Error Messages for CDS Requests.

For non-Python users, please note that the CDS API is REST-based so it can be wrapped by any programming language. Please see this example with the R package: Download CDS ERA5 data using R.

Users can also set the PROXY within the CDS API script:

import requests
import cdsapi


session = requests.Session()

session.proxies = {
   'http': 'http://10.10.10.10:8000',
   'https': 'http://10.10.10.10:8000',
}

client = cdsapi.Client(session=session)

3) The CDS Toolbox is a set of software which enables users to develop custom-made applications via an on-line interface (Figure 3). The applications can make use of the content of the CDS to analyse, monitor and predict the evolution of both climate drivers and impacts. The CDS Toolbox is a catalogue of software that can be classified as:

  • tools that perform basic operations on data, such as computation of statistics, sub-setting, averaging, value at points, etc.
  • workflows that combine the output of tools and feed this as input into other tools to produce derived results  
  • applications, which make use of workflows and selected data and products in the CDS

The CDS Toolbox documentation provides a description of the CDS Toolbox content including Tutorials, Applications Gallery and Guides. In addition, a graphical, user-friendly tour is presented when the user first connects to the CDS Toolbox editor .

A new Toolbox forum is also available for user to find answers and share knowledge.

Figure 3 CDS Toolbox.


Please note:  CDS datasets are covered by one or more licences, and users have to accept them in order to download datasets (whether through the web interface, or the CDS API, or the toolbox). At the time this article was written, the acceptance of the relevant licences can only be carried out through the CDS web interface for the relevant dataset.

In some cases, data can has multiple licenses because it comes from different providers.


As the CDS is a distributed platform, CDS datasets are hosted at a number of different locations. Some data are stored on the CDS disks; others are hosted on the data providers' storage systems, e.g. the ECMWF Meteorological Archival and Retrieval System (MARS).

Table 2 presents the ERA5 datasets which are available on CDS disks ('MARS internal)'. Table 3 and Table 4 show the CDS datasets which are stored in the tape library (referred to as 'MARS external'), and in the data providers archives respectively.

The way the user selects the items to include in a single CDS request can make a significant difference in terms of performance. Please see the page Efficiency tips for how to build an efficient request.

On the CDS, requests and relevant results are generally cached  for 1.5 to 2 days, depending on the user load on the CDS system. Thereafter, files are deleted starting from the oldest. Please note that cached data is used to fulfil a CDS request only if a given CDS request is exactly identical to a previous one.

Request states

After sending a request, the user can track its state on the 'Your Requests' page of the CDS web interface. Users can also check the status of the CDS system at the live page. There are five different states of a request:

  1. Queued. Each request is assigned a unique ID and a priority. The priority is chosen according to different criteria, such as the origin of the request (CDS web interface/API/Toolbox). For example, the CDS web interface usually has higher priority because it is an interactive application and users expect an immediate response to their request..
  2. In progress. The request is being fulfilled and the data is being collected from the archive.
  3. Failed. The request encountered problems.
  4. Unavailable. The data has expired from cache and therefore cannot be retrieved at the current time. In this case the request should be resubmitted.
  5. Complete. The resulting data file is ready to download.

User can check the live status of the CDS queues here https://cds.climate.copernicus.eu/live/queue

Please note:  

  • Users can also follow the status of their CDS API request on the 'Your Requests' CDS web page, while the request is running.
  • If the CDS API request completes successfully, the data file will be automatically downloaded to  the user's  computer. The details of this request will be removed from the 'Your Requests' CDS web page, and the data file will not be downloadable from this page.
  • If the request fails, the details of this CDS API request will remain on the 'Your Requests' CDS web page, for further investigation.

Limits

Limits are set on usage of CDS resources to ensure an appropriate level of performance.

They are divided in three categories: per-user, global and system, and these limits are shown in Table 1 (last reviewed on ).

The CDS will queue requests which would otherwise cause any of these limits to be exceeded. Please note that these limits are changed from time to time according to the current workload of the system and number of concurrent tasks.

The 'live' status of the limits values can be checked here https://cds.climate.copernicus.eu/live/limits

Per-user

Limit on simultaneous tasks/requests
Any request (web interface, API, and toolbox all together)10
Toolbox workflows50

Simultaneous data requests for public applications

35
Requests that access the ECMWF archive1
Requests that access the online CDS data3
Global
Requests that access CMIP615
Requests that access ESA CCI2
Requests that access GRUAN8
Requests that access Glacier data10
Requests that access Sea Level data10
Requests that access Water SIS data6
Requests that access the ECMWF archive50
Requests that access Glofas forecast5
Requests that access the online CDS data250
System
Tasks of type 'adaptor'374
Tasks of type 'cdscompute'528

Moreover, CDS data requests also have limits in terms of number of fields and volume size which are different for each dataset (see the tables below). These values are dependent on each dataset's structure and where the data is stored. Again, these restrictions are introduced to help the system maintain good performance and minimise the queue time.

When a user CDS web request exceeds the number of fields limit, an information message appears at the bottom of the web interface page. Note that these limits are also enforced for requests sent via the CDS API and the CDS Toolbox.

Figure 4 Information message when a user CDS web request exceeds the number of fields limit.

Datasets

The tables below summarise the number of fields and volume size limits, as well as the major features of all CDS datasets. Table 2 shows the datasets stored in 'MARS internal', whereas Table 3 presents the datasets stored in 'MARS external', and Table 4 shows datasets maintained by external data providers.

Data hosted on the CDS/'MARS internal'

Data hosted on 'MARS external'

DatasetVolume size limitNumber of fields limit
Arctic regional reanalysis on height levels from 1998 to 2019175 GB for GRIB files, 30 GB for netCDF files90000

Arctic regional reanalysis on pressure levels from 1998 to 2019

175 GB for GRIB files, 30 GB for netCDF files90000

Arctic regional reanalysis on model levels from 1998 to 2019

175 GB for GRIB files, 30 GB for netCDF files90000
Arctic regional reanalysis on single levels from 1998 to 2019175 GB for GRIB files, 30 GB for netCDF files90000

CERRA sub-daily regional reanalysis data for Europe on model levels from 1984 to present

175 GB for GRIB files, 30 GB for netCDF files90000

CERRA sub-daily regional reanalysis data for Europe on height levels from 1984 to present

175 GB for GRIB files, 30 GB for netCDF files90000

CERRA sub-daily regional reanalysis data for Europe on pressure levels from 1984 to present

175 GB for GRIB files, 30 GB for netCDF files90000

CERRA sub-daily regional reanalysis data for Europe on single levels from 1984 to present

175 GB for GRIB files, 30 GB for netCDF files90000
ERA5 complete from 1959 to present175 GB for GRIB files, 30 GB for netCDF files50000
ERA5.1 complete175 GB for GRIB files, 30 GB for netCDF filesn/a
Reforecasts of river discharge and related data by the European Flood Awareness System175 GB for GRIB files, 30 GB for netCDF files100

River discharge and related forecasted data by the European Flood Awareness System

175 GB for GRIB files, 30 GB for netCDF files1000

River discharge and related historical data from the European Flood Awareness System

175 GB for GRIB files, 30 GB for netCDF files1000
Seasonal forecasts of river discharge and related data by the European Flood Awareness System175 GB for GRIB files, 30 GB for netCDF files100
Seasonal reforecasts of river discharge and related data by the European Flood Awareness System175 GB for GRIB files, 30 GB for netCDF files25
Reforecasts of river discharge and related data by the Global Flood Awareness System175 GB for GRIB files, 30 GB for netCDF files950

River discharge and related forecasted data by the Global Flood Awareness System

175 GB for GRIB files, 30 GB for netCDF files60

River discharge and related historical data from the Global Flood Awareness System

175 GB for GRIB files, 30 GB for netCDF files500
Seasonal forecasts of river discharge and related data by the Global Flood Awareness System175 GB for GRIB files, 30 GB for netCDF files150
Seasonal reforecasts of river discharge and related data from the Global Flood Awareness System175 GB for GRIB files, 30 GB for netCDF files125

Seasonal forecast anomalies on pressure levels from 2017 to present

175 GB for GRIB files, 30 GB for netCDF files10000

Seasonal forecast anomalies on single levels from 2017 to present

175 GB for GRIB files, 30 GB for netCDF files10000

Seasonal forecast daily data on pressure levels from 2017 to present

175 GB for GRIB files, 30 GB for netCDF files10000

Seasonal forecast daily data on single levels from 2017 to present

175 GB for GRIB files, 30 GB for netCDF files10000

Seasonal forecast monthly statistics on single levels from 2017 to present

175 GB for GRIB files, 30 GB for netCDF files10000

Seasonal forecast monthly statistics on pressure levels from 2017 to present

175 GB for GRIB files, 30 GB for netCDF files10000

Complete UERRA regional reanalysis for Europe from 1961 to present

175 GB for GRIB files, 30 GB for netCDF filesUnlimited

UERRA regional reanalysis for Europe on height levels from 1961 to present

175 GB for GRIB files, 30 GB for netCDF files90000

UERRA regional reanalysis for Europe on pressure levels from 1961 to present

175 GB for GRIB files, 30 GB for netCDF files90000

UERRA regional reanalysis for Europe on single levels from 1961 to present

175 GB for GRIB files, 30 GB for netCDF files90000

UERRA regional reanalysis for Europe on soil levels from 1961 to present

175 GB for GRIB files, 30 GB for netCDF files90000

Data hosted by external contractors

DatasetVolume size limitNumber of fields limit

Aerosol properties gridded data from 1995 to present derived from satellite observations

(Under review)100

Agroclimatic indicators from 1951 to 2099 derived from climate projections

(Under review)1000

Agrometeorological indicators from 1979 to 2018 derived from reanalysis

(Under review)100
Alpine gridded monthly precipitation data since 1871 derived from in-situ observations(Under review)10000

Arctic route availability and cost projection derived from climate projections of ice concentration and thickness

(Under review)10000

Carbon dioxide data from 2002 to present derived from satellite sensors

(Under review)10000

Climate data for the European energy sector from 1979 to 2016 derived from ERA-Interim

(Under review)1
Climate and energy indicators for Europe from 2005 to 2100 derived from climate projections(Under review)n/a

Climate variables for cities in Europe from 2008 to 2017

(Under review)1000

Climatic suitability for the presence and seasonal activity of the Aedes albopictus mosquito for Europe derived from climate projections

(Under review)100000

Climate suitability indicators for tourism from 1970 to 2100 over Europe derived from climate projections

(Under review)12
(Under review)1200

CMIP5 daily data on pressure levels

(Under review)12

CMIP5 monthly data on pressure levels

(Under review)12

CMIP5 daily data on single levels

(Under review)12

CMIP5 monthly data on single levels

(Under review)12
CMIP6 climate projections(Under review)999999

CORDEX regional climate model data on single levels for Europe

(Under review)12
Crop productivity and evapotranspiration indicators from 2000 to present derived from satellite observations(Under review)100
Downscaled bioclimatic indicators for selected regions from 1950 to 2100 derived from climate projections(Under review)100
Downscaled bioclimatic indicators for selected regions from 1979 to 2018 derived from reanalysis(Under review)100
Earth's radiation budget from 1979 to present derived from satellite observations(Under review)10000

E-OBS daily gridded meteorological data for Europe from 1950 to present derived from in-situ observations

(Under review)100

Essential climate variables for assessment of climate variability from 1979 to present

(Under review)1000

Essential climate variables for water sector applications derived from CMIP5 projections

(Under review)72
Eutrophication indicators for the Northwest European Shelf and Mediterranean Sea from 2006 up to 2100(Under review)1000

Fire burned area from 2001 to present derived from satellite observations

(Under review)10
(Under review)1000

Fire danger indices historical data from the Copernicus Emergency Management Service

(Under review)3720
Fire radiative power and active fire pixels from 2020 to present derived from satellite observations(Under review)100
Fish abundance and catch data for the Northwest European Shelf and Mediterranean Sea from 2006 to 2098 derived from climate projections(Under review)1000
Global bioclimatic indicators from 1950 to 2100 derived from climate projections(Under review)100
Global bioclimatic indicators from 1979 to 2018 derived from reanalysis(Under review)100

Glaciers elevation and mass change data from 1850 to present from the Fluctuations of Glaciers Database

(Under review)10

Glaciers distribution data from the Randolph Glacier Inventory for year 2000

(Under review)10
Global land surface atmospheric variables from 1755 to 2020 from comprehensive in-situ observations(Under review)n/a
Global marine surface meteorological variables from 1851 to 2010 from comprehensive in-situ observations(Under review)n/a
(Under review)100


(Under review)100
Gravimetric mass balance data for the Antarctic and Greenland ice sheets from 2003 to 2017 derived from satellite observations(Under review)100
Greenland ice sheet annual gridded velocity data from 2017 to present derived from satellite observations(Under review)10
Gridded monthly climate projection dataset underpinning the IPCC AR6 Interactive Atlas(Under review)

Heat waves and cold spells in Europe derived from climate projections

(Under review)1000
Ice sheet surface elevation change rate for Greenland and Antarctica from 1992 to present derived from satellite observations(Under review)10
(Under review)(Under review)
In situ total column ozone and ozone soundings from 1924 to present from the World Ozone and Ultraviolet Radiation Data Centre(Under review)n/a
Lake surface water temperature from 1995 to present derived from satellite observations(Under review)10000

Lake water levels from 1992 to present derived from satellite observations

(Under review)10000

Land cover classification gridded maps from 1992 to present derived from satellite observations

(Under review)10

Leaf area index and fraction absorbed of photosynthetically active radiation 10-daily gridded data from 1998 to present

(Under review)120

Marine biogeochemistry data for the Northwest European Shelf and Mediterranean Sea from 2006 up to 2100 derived from climate projections

(Under review)1000
(Under review)100

Methane data from 2002 to present derived from satellite sensors

(Under review)10000
Monthly and 6-hourly total column water vapour over ocean from 1988 to 2020 derived from satellite observations(Under review)100
Monthly total column water vapour over land and ocean from  2002 to 2012 derived from satellite observations(Under review)100

Mountain tourism meteorological and snow indicators for Europe from 1950 to 2100 derived from reanalysis and climate projections

(Under review)1000

Near surface meteorological variables from 1979 to 2018 derived from bias-corrected reanalysis

(Under review)1000
Nordic gridded temperature and precipitation data from 1971 to present derived from in-situ observations(Under review)20000

Ocean colour daily data from 1997 to present derived from satellite observations

(Under review)31

Ocean fronts data for the Northwest European Shelf and Mediterranean Sea from 1991 up to 2100

(Under review)10000

Ocean surface wave indicators for the European coast from 1977 to 2100 derived from climate projections

(Under review)10

Ocean surface wave time series for the European coast from 1976 to 2100 derived from climate projections

(Under review)10
ORAS5 global ocean reanalysis monthly data from 1958 to present(Under review)360

Ozone monthly gridded data from 1970 to present

(Under review)3500

Performance indicators for offshore wind farms in Europe from 1977 to 2100 derived from climate projections

(Under review)120
Precipitation monthly and daily gridded data from 2000 to 2017 derived from satellite microwave observations(Under review)1200
Precipitation monthly and daily gridded data from 1979 to present derived from satellite measurements (Under review)1200
Surface radiation budget from 1982 to present derived from satellite observations(Under review)1200

Sea ice monthly and daily gridded data from 1978 to present derived from satellite sensors

(Under review)1000

Sea level daily gridded data for the Black Sea from 1993 to present

(Under review)37200

Sea level daily gridded data for the global ocean from 1993 to present

(Under review)372

Sea level daily gridded data for the Mediterranean Sea from 1993 to present

(Under review)37200

Sea surface temperature daily data from 1981 to present derived from satellite observations

(Under review)200

Sea surface temperature daily gridded data from 1981 to 2016 derived from a multi-product satellite-based ensemble

(Under review)12

Ship performance along standard shipping routes derived from reanalysis and seasonal forecasts

(Under review)1000

Soil moisture gridded data from 1978 to present

(Under review)12000

Surface albedo 10-daily gridded data from 1981 to present

(Under review)20
Surface radiation budget from 1982 to present derived from satellite observations(Under review)1200
Temperature and precipitation gridded data for global and regional domains derived from in-situ and satellite observations(Under review)400

Temperature statistics for Europe derived from climate projections

(Under review)1000

Thermal comfort indices derived from ERA5 reanalysis

(Under review)2000
Tropospheric humidity profiles averaged monthly and zonally from 2006 to present derived from satellite observations(Under review)10000
Upper tropospheric humidity gridded data from 1999 to present derived from satellite observations(Under review)400

Water level change indicators for the European coast from 1977 to 2100 derived from climate projections

(Under review)10

Water level change time series for the European coast from 1977 to 2100 derived from climate projections

(Under review)10

Water quantity indicators for Europe

(Under review)10000

Water quality indicators for European rivers

(Under review)10000
Water sector indicators of hydrological change across Europe from 2011 to 2095 derived from climate simulations
1000

Efficiency tips

  1. Where the data are actually  stored can make a significant difference in performance. CDS data hosted in 'MARS internal' is stored on CDS disks, and so is faster to retrieve. The  'MARS external' datasets are stored in the ECMWF MARS (tape) archive, and in this case it is important to request as much data as possible from the same tape file in your CDS request.
  2. Submit small requests over very large and heavy requests. This will ensure your requests are not penalised in the CDS request queue. In particular:
    1. For ERA5 data requests, please see: How to download ERA5. The first example in CDS API and CDS Toolbox examples section below shows how to efficiently download a whole year of hourly data for 2m temperature (grib format, for an area subset) from the CDS, by asking for one month of data per request.

    2. For C3S seasonal forecast data requests, please see: Recommendations and efficiency tips for C3S seasonal forecast datasets.
    3. For UERRA data requests, please see: UERRA retrieval efficiency.
  3. When using the CDS API or the CDS Toolbox, it is advised that users take as an example the API request or toolbox request script shown at the bottom of the CDS web  'Download data' page for the dataset of interest, and use this as the basis for your request.
  4. Some ERA5 datasets, such as reanalysis-era5-complete, do not appear in the CDS catalogue on the web interface, but users can still retrieve the data through the CDS API. In these cases, users can make use of a subset of  the  ECMWF MARS keywords in their CDS API request, and should also follow the MARS efficiency rule of thumb (the idea is to request as much data as possible from the same tape file or to reduce the number of tapes involved.).
  5. Users can check the allowed and not allowed keywords for the CDS API requests in the following article: Climate Data Store (CDS) API Keywords

CDS API and CDS Toolbox examples

CDS API Request for hourly data of one variable looping though months and years ( e.g 2m temperature for all months in 2018 and 2019)

Request for hourly data for 2m temperature for 2018 and 2019
#!/usr/bin/env python3
import cdsapi

c = cdsapi.Client()

first_year = 2018
last_year = 2019

for year in range(first_year, last_year + 1):
    for month in range(1, 13):
        print("=========================================================")
        print("Downloading {year}-{month:02d}".format(year=year, month=month))
        c.retrieve(
            'reanalysis-era5-single-levels',
            {
                'product_type': 'reanalysis',
                'variable': '2m_temperature',
                'year': str(year),
                'month': "{month:02d}".format(month=month),
                'day': [
                    '01', '02', '03',
                    '04', '05', '06',
                    '07', '08', '09',
                    '10', '11', '12',
                    '13', '14', '15',
                    '16', '17', '18',
                    '19', '20', '21',
                    '22', '23', '24',
                    '25', '26', '27',
                    '28', '29', '30',
                    '31',
                ],
                'time': [
                    '00:00', '01:00', '02:00',
                    '03:00', '04:00', '05:00',
                    '06:00', '07:00', '08:00',
                    '09:00', '10:00', '11:00',
                    '12:00', '13:00', '14:00',
                    '15:00', '16:00', '17:00',
                    '18:00', '19:00', '20:00',
                    '21:00', '22:00', '23:00',
                ],
                'area': [
                    90, 170, 80,
                    180,
                ],
                'format': 'grib',
            },
            "{year}-{month:02d}.grib".format(year=year, month=month))

CDS API Request for Temperature data from the ERA5 hourly dataset on pressure levels ('renalysis-era5-pressure-levels') on 11-10-2018, from 08:00 to 18:00 UTC on pressure level 1000 hPa.

CDS API request example
import cdsapi

c = cdsapi.Client()

c.retrieve(
    'reanalysis-era5-pressure-levels',
    {
        'product_type':'reanalysis',
        'variable':'temperature',
        'pressure_level':'1000',
        'year':'2018',
        'month':'10',
        'day':'11',
        'time':[
            '08:00','09:00','10:00',
            '11:00','12:00','13:00',
            '14:00','15:00','16:00',
            '17:00','18:00'
        ],
        'format':'grib'
    },
    'download.grib')

CDS Toolbox request for Temperature data from the ERA5 hourly dataset on pressure levels ('renalysis-era5-pressure-levels') on 11-10-2018, from 08:00 to 18:00 UTC on pressure level 1000 hPa.

CDS Toolbox request example
import cdstoolbox as ct

data = ct.catalogue.retrieve(
    'reanalysis-era5-pressure-levels',
    {
        'product_type':'reanalysis',
        'variable':'temperature',
        'pressure_level':'1000',
        'year':'2018',
        'month':'10',
        'day':'11',
        'time':[
            '08:00','09:00','10:00',
            '11:00','12:00','13:00',
            '14:00','15:00','16:00',
            '17:00','18:00'
        ],
        'format':'grib'
    })

CDS API  request for Temperature data from ERA5 complete dataset ('reanalysis-era5-complete') for July 2019 on all model levels (1-137)

CDS API request example using MARS keywords
import cdsapi

c = cdsapi.Client()
c.retrieve('reanalysis-era5-complete', {
    'class': 'ea',
    'date': '2019-07-01/to/2019-07-31',
    'expver': '1',
    'levelist': '1/2/3/4/5/6/7/8/9/10/11/12/13/14/15/16/17/18/19/20/21/22/23/24/25/26/27/28/29/30/31/32/33/34/35/36/37/38/39/40/41/42/43/44/45/46/47/48/49/50/51/52/53/54/55/56/57/58/59/60/61/62/63/64/65/66/67/68/69/70/71/72/73/74/75/76/77/78/79/80/81/82/83/84/85/86/87/88/89/90/91/92/93/94/95/96/97/98/99/100/101/102/103/104/105/106/107/108/109/110/111/112/113/114/115/116/117/118/119/120/121/122/123/124/125/126/127/128/129/130/131/132/133/134/135/136/137',
    'levtype': 'ml',
    'param': '130',
    'step': '0',
    'stream': 'oper',
    'time': '09:00:00',
    'type': '4v',
}, 'output')

This document has been produced in the context of the Copernicus Climate Change Service (C3S).

The activities leading to these results have been contracted by the European Centre for Medium-Range Weather Forecasts, operator of C3S on behalf of the European Union (Delegation Agreement signed on 11/11/2014 and Contribution Agreement signed on 22/07/2021). All information in this document is provided "as is" and no guarantee or warranty is given that the information is fit for any particular purpose.

The users thereof use the information at their sole risk and liability. For the avoidance of all doubt , the European Commission and the European Centre for Medium - Range Weather Forecasts have no liability in respect of this document, which is merely representing the author's view.