Interval Shading Contour Example
| HTML |
|---|
<font size="-2" color="#616161">GRIB, Cylindrical</font> |
 Image Added Image Added | Contour Shading and Positional Legend Example
| HTML |
|---|
<font size="-2" color="#616161">GRIB, Cylindrical</font> |
 Image Added Image Added | 2m Temperature Plot Example
 Image Removed Image Removed | Grid Values and Contour Levels Example
 Image Removed Image Removed | Temperature Below 0C Example
 Image Removed Image Removed | Boundaries, Cities and Rivers Example
 Image Removed Image Removed |
Disjoint Legend Example
 Image Removed Image Removed | Histogram Legend Example
 Image Removed Image Removed | Difference Contouring 1 Example
 Image Removed Image Removed | Split Contouring Example
 Image Removed Image Removed |
Humidity advection Example
 Image Removed Image Removed | Streamlines Example
 Image Removed Image Removed | Contour Shading and Positional Legend Example
Image Removed | Interval Shading Contour Example
Image Removed |
Vorticity and Wind Example
 Image Removed Image Removed | Layoutx3 Example
 Image Removed Image Removed | Model-Obs Difference Example
 Image Removed Image Removed | BUFR Synop Example
 Image Removed Image Removed |
ODB Radiance Map Example
 Image Removed Image Removed | ODB Temp Wind Example
 Image Removed Image Removed | Aircraft observation Example
 Image Removed Image Removed | Geoline on Map Example
 Image Removed Image Removed |
Geocircle on Map Example
 Image Removed Image Removed | Wind Vectors from Lists Example
 Image Removed Image Removed | Cross Section Example
 Image Removed Image Removed | Cross Section with Orography Example
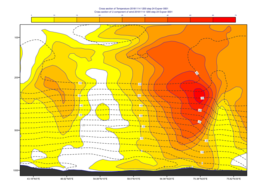 Image Removed Image Removed |
<font size="-2" color="#616161">GRIB, Cylindrical</font> |
Image Added | Layoutx3 Example
| HTML |
|---|
<font size="-2" color="#616161">GRIB, Cylindrical</font> |
Image Added |
Vorticity and Wind Example
| HTML |
|---|
<font size="-2" color="#616161">GRIB, Polar Stereographic</font> |
Image Added | Wind Coloured By Temperature Example
| HTML |
|---|
<font size="-2" color="#616161">GRIB, Cylindrical</font> |
 Image Added Image Added | Temperature Gradient Vector Example
| HTML |
|---|
<font size="-2" color="#616161">GRIB, Polar Stereographic</font> |
 Image Added Image Added | Humidity advection Example
| HTML |
|---|
<font size="-2" color="#616161">GRIB, Cylindrical</font> |
Image Added |
Storm track Example
| HTML |
|---|
<font size="-2" color="#616161">GRIB, CSV, Polar Stereographic</font> |
 Image Added Image Added | Streamlines Example
| HTML |
|---|
<font size="-2" color="#616161">GRIB, Cylindrical</font> |
Image Added | SST on Extended Cylindrical Map Example
| HTML |
|---|
<font size="-2" color="#616161">GRIB, Cylindrical</font> |
 Image Added Image Added | Histogram Legend Example
| HTML |
|---|
<font size="-2" color="#616161">GRIB, Polar Stereographic</font> |
Image Added |
Disjoint Legend Example
| HTML |
|---|
<font size="-2" color="#616161">GRIB, Polar Stereographic</font> |
Image Added | Grid Values and Contour Levels Example
| HTML |
|---|
<font size="-2" color="#616161">GRIB, Cylindrical</font> |
Image Added | Temperature Below 0C Example
| HTML |
|---|
<font size="-2" color="#616161">GRIB, Cylindrical</font> |
Image Added | Boundaries, Cities and Rivers Example
| HTML |
|---|
<font size="-2" color="#616161">Cylindrical</font> |
Image Added |
Difference Contouring 1 Example
| HTML |
|---|
<font size="-2" color="#616161">GRIB, Cylindrical</font> |
Image Added | Split Contouring Example
| HTML |
|---|
<font size="-2" color="#616161">GRIB, Cylindrical</font> |
Image Added | Model-Obs Difference Example
| HTML |
|---|
<font size="-2" color="#616161">GRIB, BUFR, Cylindrical</font> |
Image Added | BUFR Synop Example
| HTML |
|---|
<font size="-2" color="#616161">BUFR, Cylindrical</font> |
Image Added |
Coloured observation values Example
| HTML |
|---|
<font size="-2" color="#616161">BUFR, Cylindrical</font> |
 Image Added Image Added | ODB Radiance Map Example
| HTML |
|---|
<font size="-2" color="#616161">ODB, Cylindrical</font> |
Image Added | ODB Temp Wind Example
| HTML |
|---|
<font size="-2" color="#616161">ODB, Cylindrical</font> |
Image Added | Aircraft observation Example
| HTML |
|---|
<font size="-2" color="#616161">Geopoints, Cylindrical</font> |
Image Added |
Geoline on Map Example
| HTML |
|---|
<font size="-2" color="#616161">List Data, Polar Stereographic</font> |
Image Added | Geocircle on Map Example
| HTML |
|---|
<font size="-2" color="#616161">List Data, Polar Stereographic</font> |
Image Added | Wind Vectors from Lists Example
| HTML |
|---|
<font size="-2" color="#616161">List Data, Cylindrical</font> |
Image Added | Cross Section Example
| HTML |
|---|
<font size="-2" color="#616161">GRIB, Cross Section View</font> |
Image Added |
Cross Section with Orography Example
| HTML |
|---|
<font size="-2" color="#616161">GRIB, Cross Section View</font> |
Image Added | Hovmoeller Area Average Example
| HTML |
|---|
<font size="-2" color="#616161">GRIB, Hovmoller View</font> |
 Image Added Image Added | Tephigram from Lists Example
| HTML |
|---|
<font size="-2" color="#616161">List Data, Thermo View</font> |
 Image Added Image Added | Tephigram from BUFR Example
| HTML |
|---|
<font size="-2" color="#616161">BUFR, Thermo View</font> |
 Image Added Image Added |
Parcel method on Skew-T Example
| HTML |
|---|
<font size="-2" color="#616161">GRIB, Thermo View</font> |
 Image Added Image Added | Time Series from GRIB Example
| HTML |
|---|
<font size="-2" color="#616161">GRIB, Cartesian View</font> |
| Hovmoeller Area Average Example
Image Removed | Tephigram from Lists Example
Image Removed | Parcel method on Skew-T Example
Image Removed | Time Series from GRIB Example
 | Time Series Curves From Lists Example
| HTML |
|---|
<font size="-2" color="#616161">List Data, Cartesian View</font> |
 | ODB scatterplot Example
| HTML |
|---|
<font size="-2" color="#616161">ODB, Cartesian View</font> |
 |
ODB Wind Profiler Example
| HTML |
|---|
<font size="-2" color="#616161">ODB, Cartesian View</font> |
 | Bar Plotting Example
| HTML |
|---|
<font size="-2" color="#616161">List Data, Cartesian View</font> |
 | Taylor diagram Example
| HTML |
|---|
<font size="-2" color="#616161">List Data, Taylor View</font> |
 |