| HTML |
|---|
<font size="-2" color="#616161">GRIB, Cylindrical</font> |


| HTML |
|---|
<font size="-2" color="#616161">GRIB, Polar Stereographic</font> |
 Two Wind Fields and Legend Box Example
| HTML |
|---|
<font size="-2" color="#616161">GRIB, Cylindrical</font> |
 Derive Wind from Spectral Divergence and Vorticity Example
| HTML |
|---|
<font size="-2" color="#616161">GRIB, Polar Stereographic</font> |
 Derive Divergent and Rotational Wind from Spectral Divergence and Vorticity Example
html
<font size="-2" color="#616161">GRIB, Polar Stereographic</font> Windgust and MSLP with 10m Wind Example
| HTML |
|---|
<font size="-2" color="#616161">GRIB, Polar Stereographic</font> |
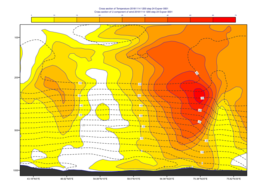
 Monthly Mean with Gradient Shading Example
| HTML |
|---|
<font size="-2" color="#616161">GRIB, Robinson</font> |
 Contour Shading Only Over Land Example
| HTML |
|---|
<font size="-2" color="#616161">GRIB, Mollweide</font> |
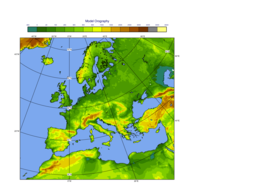
 Model Orography with Land Sea Mask Example
| HTML |
|---|
<font size="-2" color="#616161">GRIB, Polar Stereographic</font> |
 De-accumulate Precipitation Forecast Example
| HTML |
|---|
<font size="-2" color="#616161">GRIB, Cylindrical</font> |
 Potential Temperature Example
| HTML |
|---|
<font size="-2" color="#616161">GRIB, Cylindrical</font> |
 Equivalent Potential Temperature Example
| HTML |
|---|
<font size="-2" color="#616161">GRIB, Cylindrical</font> |


| HTML |
|---|
<font size="-2" color="#616161">GRIB, Polar Stereographic</font> |


Storm track Example
|

| HTML |
|---|
<font size="-2" color="#616161">GRIB, Cylindrical</font> |
 ENS Spaghetti Map Example
| HTML |
|---|
<font size="-2" color="#616161">GRIB, Cylindrical</font> |


| HTML |
|---|
<font size="-2" color="#616161">GRIB, Geos</font> |


| HTML |
|---|
<font size="-2" color="#616161">GRIB, Cylindrical</font> |


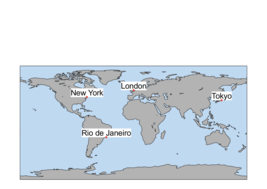
Boundaries, Cities and Rivers Example
|
|

Difference Contouring 1 Example
|

Split Contouring Example
|
 NetCDF Ozone Layout 2x2 Example
| HTML |
|---|
<font size="-2" color="#616161">NetCDF, Polar Stereographic</font> |
 NetCDF Wind Example
| HTML |
|---|
<font size="-2" color="#616161">NetCDF, Polar Stereographic</font> |
 NetCDF Sea Currents with Fix-sized Vectors Example
| HTML |
|---|
<font size="-2" color="#616161">NetCDF, Polar Stereographic</font> |

|


html
<font size="-2" color="#616161">BUFR, Cylindrical</font> BUFR Temp Example
| HTML |
|---|
<font size="-2" color="#616161">BUFR, Polar Stereographic</font> |
 Coloured Observation Values
html
<font size="-2" color="#616161">BUFR, Cylindrical</font>
Aircraft |


| HTML |
|---|
<font size="-2" color="#616161">Geopoints, Cylindrical</font> |
 Coastlines Resolutions Example
| HTML |
|---|
<font size="-2" color="#616161">Cylindrical</font> |

| HTML |
|---|
<font size="-2" color="#616161">Cylindrical</font> |
 Boundaries, Cities and Rivers Example
| HTML |
|---|
<font size="-2" color="#616161">Cylindrical</font> |
 Custom Shapefile Map Layer with Major River Basins Example
| HTML |
|---|
<font size="-2" color="#616161">Shape file, Cylindrical</font> |


html
<font size="-2" color="#616161">List Data, Polar Stereographic</font>

| HTML |
|---|
<font size="-2" color="#616161">GRIB, CSV, Polar Stereographic</font> |

Wind |
| HTML |
|---|
<font size="-2" color="#616161">CSV, Polar Stereographic</font> |
 FLEXTRA Forward Trajectories Example
| HTML |
|---|
<font size="-2" color="#616161">FLEXTRA, Polar Stereographic</font> |
 Wind
Wind Cross Section |


| HTML |
|---|
<font size="-2" color="#616161">GRIB, Cross Section View</font> |
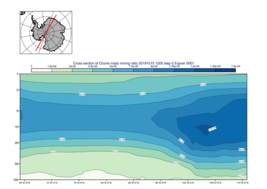
 Cross Section Going Through the South Pole Example
| HTML |
|---|
<font size="-2" color="#616161">GRIB, Cross Section View</font> |
 Cross Section Normal Wind Component with Map Example
| HTML |
|---|
<font size="-2" color="#616161">GRIB, Cross Section View</font> |
 Cross Section Parallel Wind Component with Map Example
| HTML |
|---|
<font size="-2" color="#616161">GRIB, Cross Section View</font> |
 Cross Section 3D Parallel Wind Component Example
| HTML |
|---|
<font size="-2" color="#616161">GRIB, Cross Section View</font> |

| HTML |
|---|
<font size="-2" color="#616161">GRIB, Cross Section View</font> |
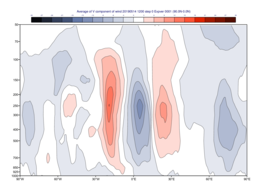
 Zonal Average Difference Example
| HTML |
|---|
<font size="-2" color="#616161">GRIB, Average View</font> |


| HTML |
|---|
<font size="-2" color="#616161">GRIB, Average View</font> |

Hovmoeller Area Average Example
|

html
<font size="-2" color="#616161">GRIB, Hovmoeller View</font> ERA5 Quasi Biennial Oscillation on Vertical Hovmoeller Example
| HTML |
|---|
<font size="-2" color="#616161">GRIB, Hovmoeller View</font> |
 Time-height Section Example
| HTML |
|---|
<font size="-2" color="#616161">GRIB, Hovmoeller View</font> |
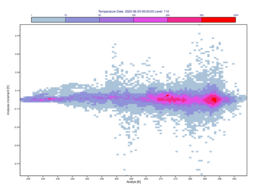
 GRIB Scatterplot Example
| HTML |
|---|
<font size="-2" color="#616161">GRIB, Cartesian View</font> |


| HTML |
|---|
<font size="-2" color="#616161">ODB, Thermo View</font> |
 Parcel Method
| HTML |
|---|
<font size="-2" color="#616161">GRIB, Thermo View</font> |
 Hodograph from BUFR Example
html
<font size="-2" color="#616161">BUFR, Cartesian View</font>


html
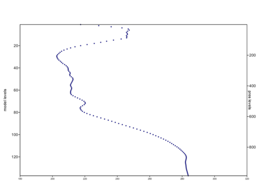
<font size="-2" color="#616161">List Data, Cartesian View</font> Curve With Log Y Axis Example
| HTML |
|---|
<font size="-2" color="#616161">List Data, Cartesian View</font> |
 CDF Curve Example
| HTML |
|---|
<font size="-2" color="#616161">GRIB, Cartesian View</font> |
 ODB Scatterplot


| HTML |
|---|
<font size="-2" color="#616161">GRIB, Cartesian View</font> |
 Curves with Different Y Scales Example
| HTML |
|---|
<font size="-2" color="#616161">GRIB, Cartesian View</font> |
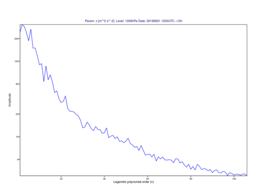
 Spherical Harmonics Spectrum Example
| HTML |
|---|
<font size="-2" color="#616161">GRIB, Cartesian</font> |