Versions Compared

Key

  • This line was added.
  • This line was removed.
  • Formatting was changed.
Section

Image Removed

In short, once you  have realised this plot, you will have understood and used the main concepts of Magics
Column
width50%


Panel
titleObjectives of the tutorial

At the end of this tutorial, you will be able to:

  • write and run small Magics python programs.
  • create meteorological maps using different projections, or Cartesian projections
  • load grib, netcdf, or simple ascii data
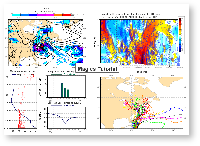
    Section
    Column
    width50%

    Image Added

    Info

    In short, once you  have realised this plot, you will have understood and used the main concepts of Magics

  • use the different action routines contour, wind, graph to visualise them
  • add text and legend
  • create a complex layout to get organise your plots
  • find your way in the documentation
Column
width50%
Info


First Step - warming up : the "Hello World" example 


Panel
titleObjectives
Section
Column
width300px
Image Removed

Image Added

Column
width70%
Panel
titleObjectives
  • get familiar with the environment
  • find your favourite editor to edit your python script
  • create your first Magics script
  • learn how to:
    • run your script
    • see your results
    • modify your script


Go to the tutorial...


...