| Section | |||||||||||||||
|---|---|---|---|---|---|---|---|---|---|---|---|---|---|---|---|
|
Step by step
In order to be able to create and use Magics objects, the Magics python package has to be imported.
from Magics.macro import *
Any Magics plots will be triggered using the plot command, the simplest plot example is :
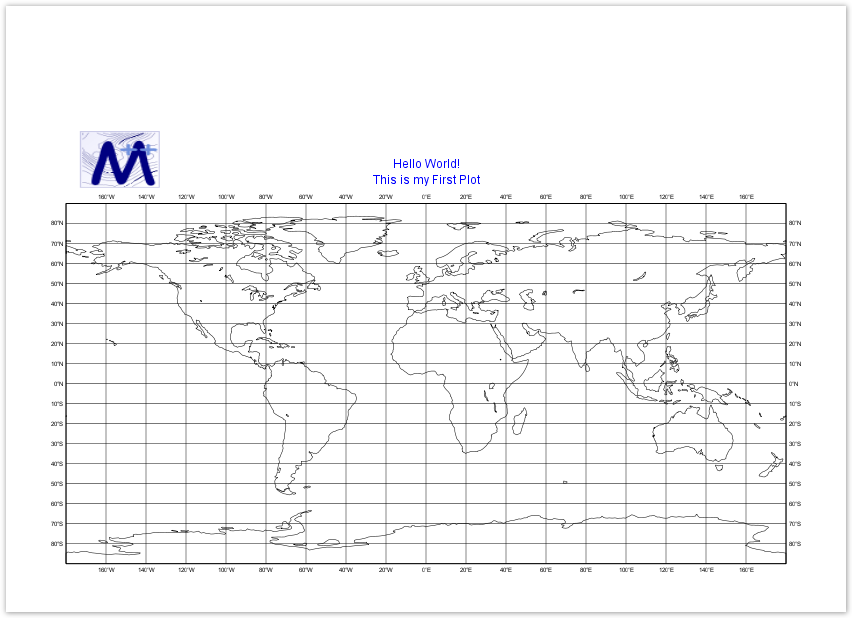
plot(mcoast())
The result will be a geographical map, using the default projection, and the default attributes of coastlines.
Magics will instantiate the default driver.
| Section | |||||||||||||||||
|---|---|---|---|---|---|---|---|---|---|---|---|---|---|---|---|---|---|
|
