...
To configure the look of your coastlines you have to create a mcoast object with the parameters you want.
The mcoast object has to be inserted in the plot command.
| Section |
|---|
| Column |
|---|
| | Code Block |
|---|
| theme | Confluence |
|---|
| language | python |
|---|
| title | Python - Coastlines |
|---|
| collapse | true |
|---|
| from Magics.macro import *
#settings of the png output
output = output(
output_formats = ['png'],
output_name = "coast",
output_name_first_page_number = "off"
)
##settings of the coastlines attributes
coast = mcoast(
map_coastline_land_shade = "on",
map_coastline_land_shade_colour = "cream",
map_grid_line_style = "dash",
map_grid_colour = "brown",
map_label_colour = "brown",
map_coastline_colour = "brown"
)
#The plot command will now use the coast object
plot(output, coast) |
|
| Column |
|---|
| 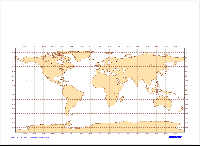 Image Added Image Added |
|
Adding a text
Magics allows the user to add of or several lines of text. The position of the text is by default above the plot, but some parameters aloow it to be moved around.
A basic html formatting can be used for colour, style, and font size.
The mtext object has to be inserted in the plot command to see the text on the result.
| Section |
|---|
| Column |
|---|
| | Code Block |
|---|
| theme | Confluence |
|---|
| language | python |
|---|
| title | Python - CoastlinesTitle |
|---|
| collapse | true |
|---|
| from Magics.macro import *
#settings of the png output
output = output(
output_formats = ['png'],
output_name = "coast",
output_name_first_page_number = "off"
)
##settings of the coastlines attributes
coast = mcoast(
map_coastline_land_shade = "on",
map_coastline_land_shade_colour = "cream",
map_grid_line_style = "dash",
map_grid_colour = "brown",
map_label_colour = "brown",
map_coastline_colour = "brown"
)
##settings of the text (notice the Html formatting)
title = mtext(
text_lines = ["Hello World!", " <b>This is my first plot</b> !"],
text_font_size = "0.7",
text_colour = "charcoal"
)
#The plot command will now use the coast objectand title objects
plot(output, coast) |
|
| Column |
|---|
| Image Removed 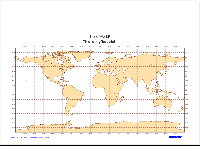 Image Added Image Added |
|