...
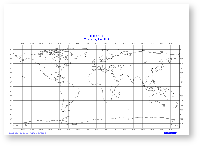
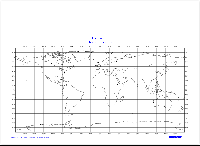
Magics will generate a postscript or a png output. To visualise the results, you can use one of the following commands:
- gv magics.ps : visualise a postscript file called magics.ps
- xv magics.png : visualise a postscript file called magics.png
- display magics.png : visualise a postscript file called magics.png
...
| Panel | ||||||||||||
|---|---|---|---|---|---|---|---|---|---|---|---|---|
| ||||||||||||
|
Go to the tutorial...
Second Step - a geographical map
| Panel | ||||||||||||
|---|---|---|---|---|---|---|---|---|---|---|---|---|
| ||||||||||||
|
Third Step - a vertical profile and a Time serie
...
Finally - a complex layout
...


