...
| Section |
|---|
| Column |
|---|
| | Info |
|---|
|
subpage_lower_left_longitude | | subpage_lower_left_latitude | | subpage_upper_right_longitude | | subpage_upper_right_latitude |
|
| Code Block |
|---|
| theme | Confluence |
|---|
| language | python |
|---|
| title | Python - Setting a projection |
|---|
| collapse | true |
|---|
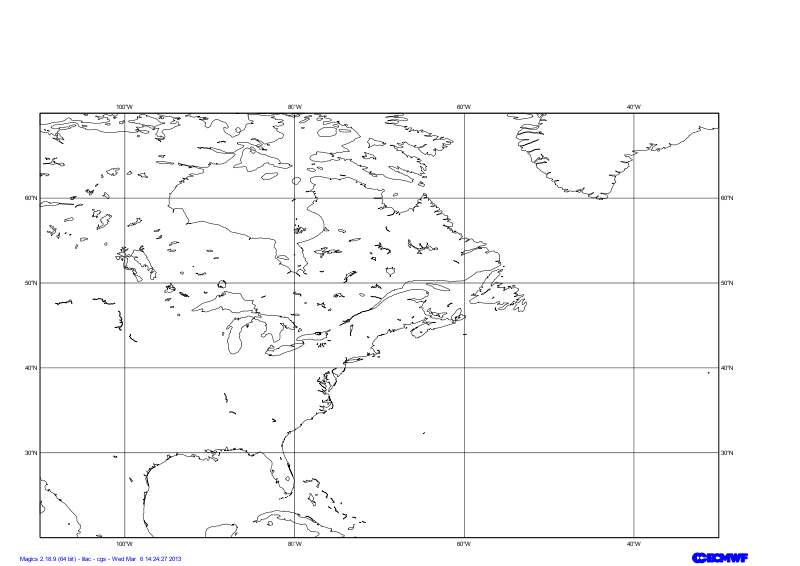
| from Magics.macro import *
#setting the output
output = output(
output_formats = ['png'],
output_name = "map_step1",
output_name_first_page_number = "off"
)
#settings of the geographical area
area = mmap(subpage_map_projection="cylindrical",
subpage_lower_left_longitude=-110.,
subpage_lower_left_latitude=20.,
subpage_upper_right_longitude=-30.,
subpage_upper_right_latitude=70.,
)
#Using a default coastlines to see the result
plot(output, area, mcoast()) |
|
| Column |
|---|
| 
|
|
...
| Section |
|---|
| Column |
|---|
| | Info |
|---|
|
map_coastline_land_shade | | map_coastline_land_shade_colour | | map_coastline_colour | | map_grid_colour | | map_grid_line_style |
|
| Code Block |
|---|
| theme | Confluence |
|---|
| language | python |
|---|
| title | Python - Coastlines |
|---|
| collapse | true |
|---|
| from Magics.macro import *
#setting the output
output = output(
output_formats = ['png'],
output_name = "map_step2",
output_name_first_page_number = "off"
)
#settings of the geographical area
area = mmap(subpage_map_projection="cylindrical",
subpage_lower_left_longitude=-110.,
subpage_lower_left_latitude=20.,
subpage_upper_right_longitude=-30.,
subpage_upper_right_latitude=70.,
)
#settings of the caostlines
coast = mcoast(map_coastline_land_shade = "on",
map_coastline_land_shade_colour = "cream",
map_grid_line_style = "dash",
map_grid_colour = "grey",
map_label = "on",
map_coastline_colour = "grey")
plot(output, area, coast) |
|
| Column |
|---|
| 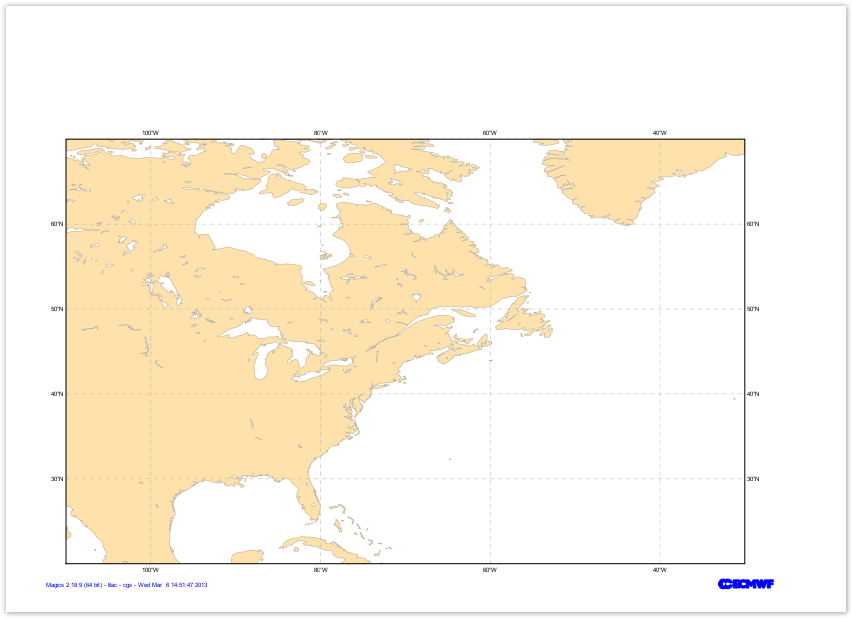 |
|
...
| Section |
|---|
| Column |
|---|
| | Info |
|---|
|
mgrib action to load the data |
|---|
| grib_input_file_name |
| mcont action to define a contouring |
|---|
| contour_line_colour | | contour_line_thickness | | contour_highlight_colour | | contour_highlight_thickness | | contour_hilo | | contour_level_selection_type | | contour_interval | | legend | | contour_legend_text |
|
| Code Block |
|---|
| theme | Confluence |
|---|
| language | python |
|---|
| title | Python - Msl Visualisation |
|---|
| collapse | true |
|---|
| from Magics.macro import *
#setting the output
output = output(
output_formats = ['png'],
output_name = "map_step3",
output_name_first_page_number = "off"
)
#settings of the geographical area
area = mmap(subpage_map_projection="cylindrical",
subpage_lower_left_longitude=-110.,
subpage_lower_left_latitude=20.,
subpage_upper_right_longitude=-30.,
subpage_upper_right_latitude=70.,
)
#settings of the caostlines
coast = mcoast(map_coastline_land_shade = "on",
map_coastline_land_shade_colour = "cream",
map_grid_line_style = "dash",
map_grid_colour = "grey",
map_label = "on",
map_coastline_colour = "grey")
#Loading the msl Grib data
msl = mgrib(grib_input_file_name="msl.grib")
#Defining the controur
contour = mcont(contour_highlight_colour= "black",
contour_highlight_thickness= 4,
contour_hilo= "off",
contour_interval= 5.,
contour_label= "on",
contour_label_frequency= 2,
contour_label_height= 0.4,
contour_level_selection_type= "interval",
contour_line_colour= "black",
contour_line_thickness= 2,
legend='on',
contour_legend_text= "Mean Sea Level Pressure",
)
plot(output, area, coast, msl, contour) |
|
| Column |
|---|
|  |
|
...
The goal of this exercise is to discover a bit more the diverse styles of visualisation offered by the mcont object.
We are pre-processed grib field containing the precipitation accumulated in the last 6 hours of the valid time. We want to disable the automatic scaling appled by Magics and use our own scaling factor, in this case 1000.
Here we will work with shading, and we will use a different technique to setup the levels we want to contour.
We want to use the follwing list of levels for contouring [0.5, 2., 4., 10., 25., 50., 100., 250.]
and the following list of colours ["cyan", "greenish_blue", "blue", "bluish_purple", "magenta", "orange", "red", "charcoal"]
| Section |
|---|
| Column |
|---|
| | Info |
|---|
| |
mgrib action to load the data |
|---|
| grib_input_file_name | | grib_automatic_scaling | | grib_scaling_factor |
| mcont action to define a contouring |
|---|
| contour_level_lineselection_colourtype | | contour_linelevel_thicknesslist | | contour_highlight_colourshade | | contour_highlightshade_thicknessmethod | | contour_shade_colour_hilomethod | | contour_level_selection_type | | contour_interval | | legend | | contour_legend_text |
|
| Code Block |
|---|
| theme | Confluence |
|---|
| language | python |
|---|
| title | Python - Use of Shading |
|---|
| collapse | true |
|---|
| #setting the output
output = output(
output_formats = ['png'],
output_name = "map_step4",
output_name_first_page_number = "off"
)
#settings of the geographical area
area = mmap(subpage_map_projection="cylindrical",
subpage_lower_left_longitude=-110.,
subpage_lower_left_latitude=20.,
subpage_upper_right_longitude=-30.,
subpage_upper_right_latitude=70.,
)
#settings of the caostlines
coast = mcoast(map_coastline_land_shade = "on",
map_coastline_land_shade_colour = "cream",
map_grid_line_style = "dash",
map_grid_colour = "grey",
map_label = "on",
map_coastline_colour = "grey")
#definition of the input data
precip = mgrib(grib_input_file_name="precip.grib",
grib_automatic_scaling='off',
grib_scaling_factor=1000.)
shading = mcont( contour_highlight= "off",
contour_hilo= "off",
contour_label="off",
contour_level_list=[0.5, 2., 4., 10., 25., 50., 100., 250.],
contour_level_selection_type= "level_list",
contour_shade= "on",
contour_shade_method= "area_fill",
contour_shade_colour_method= "list",
contour_shade_colour_list= ["cyan", "greenish_blue", "blue", "bluish_purple", "magenta", "orange", "red", "charcoal"],
legend="on")
plot(output, area, coast, precip, shading) |
|
| Column |
|---|
|  Image Added Image Added |
|
...