...
The position of New York is [41oN, 74oE, 41oN], we can give this position to Magics using the minput object, documented in Input Data Page.
...
| Section |
|---|
| Column |
|---|
| | Info |
|---|
|
| Useful input parameters |
|---|
input_x_values | | input_y_values |
| Useful Symbol parameters |
|---|
| symbol_colour | | symbol_marker_index | | symbol_height | symbol_type | | symbol_text_list | | symbol_text_font_size | | symbol_text_font_colour | | symbol_text_font_style | | symbol_text_position |
|
| Code Block |
|---|
| theme | Confluence |
|---|
| language | python |
|---|
| title | Python - Adding New- Overlay York City |
|---|
| collapse | true |
|---|
| from Magics.macro import *
#setting the output
output = output(
output_formats = ['png'],
output_name = "map_step6",
output_name_first_page_number = "off"
)
#---------------------------------------
# definition of the previsous layers
# ...
# ...
#---------------------------------------
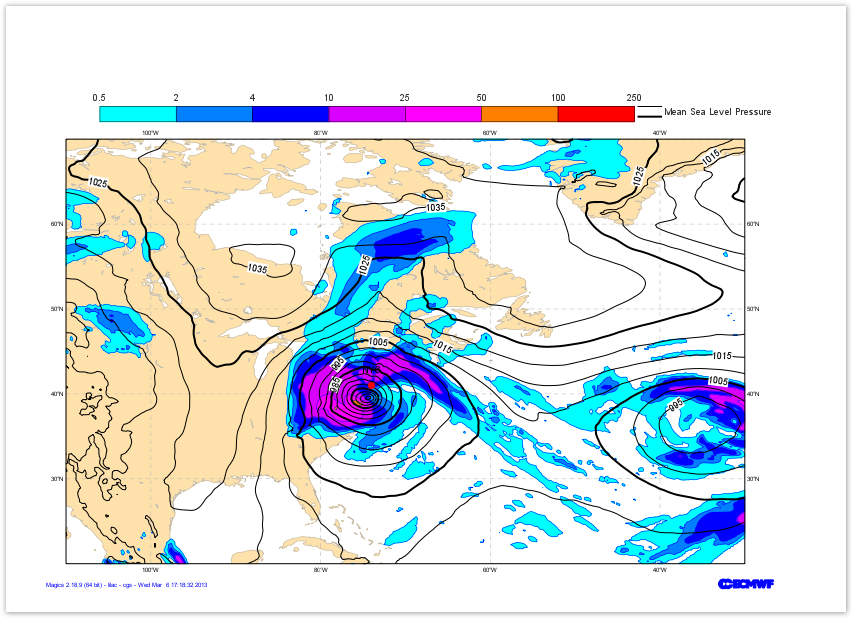
#definition of New-York city
new_york = minput(
input_x_values = [-74.],
input_y_values = [41.]
)
#definition of the symbol
point = msymb(
symbol_type = "both",
symbol_text_list = ["NYC"],
symbol_marker_index = 28,
symbol_colour = "red",
symbol_height = 0.5,
symbol_text_font_size = 0.40,
symbol_text_font_colour = "black",
symbol_text_position = "top",
symbol_text_font_style = "bold ",
)
plot(output, area, coast, precip, shading, msl, contour, new_york, point, legend) |
|
| Column |
|---|
|  |
|
...
Adding a line to show our next Cross-section
In the next exercise, we will display a Cross-section of the Vorticity across the Storm.
We want to show this line of our plot as a black thick line.
The stating point is [50oN, 90oE], the end point is [30oN, 60oE] : it can be passed to Magics using the minput object, documented in Input Data Page.
To draw the line we will use the mgraph object. All the parameters are available in the Graph Plotting Documentation.
| Section |
|---|
| Column |
|---|
| | Info |
|---|
|
| Useful input parameters |
|---|
input_x_values | | input_y_values |
| Useful Graph parameters |
|---|
| graph_line | | graph_line_colour |
|
| Code Block |
|---|
| theme | Confluence |
|---|
| language | python |
|---|
| title | Python - Adding a line |
|---|
| collapse | true |
|---|
| from Magics.macro import *
#setting the output
output = output(
output_formats = ['png'],
output_name = "map_step7",
output_name_first_page_number = "off"
)
#---------------------------------------
# definition of the previous layers
# ...
# ...
#---------------------------------------
#definition of the Xsection Line
xsection = minput(
input_x_values = [-74.],
input_y_values = [41.]
)
#definition of the graph
line = mgraph(
graph_line_colour = "black",
graph_line_thickness = 4
)
plot(output, area, coast, precip, shading, msl, contour, new_york, point, xsection, line, legend) |
|
| Column |
|---|
|  Image Added Image Added |
|
Adding a title
We have now a very nice plot... let's add a title at the top.
Text box can be embedded everywhere on a plot, but the default position will be a title at the top of the plot, above an potential legend.
The text facility is documented in the Text Plotting Page.
| Section |
|---|
| Column |
|---|
| | Info |
|---|
|
| Useful Text parameters |
|---|
text_lines | | text_font_size | | text_colour | | text_font_style |
|
| Code Block |
|---|
| theme | Confluence |
|---|
| language | python |
|---|
| title | Python - Adding a text |
|---|
| collapse | true |
|---|
| from Magics.macro import *
#setting the output
output = output(
output_formats = ['png'],
output_name = "map_step8",
output_name_first_page_number = "off"
)
#---------------------------------------
# definition of the previous layers
# ...
# ...
#---------------------------------------
#definition of the text
title = mtext(text_lines=['Sandy', '30th of October 2012'],
text_font_size = 0.8,
text_colour= "charcoal",
text_font_style='bold',
)
plot(output, area, coast, precip, shading, msl, contour, new_york, point, xsection, line, legend, title) |
|
| Column |
|---|
|  Image Added Image Added |
|