from Magics.macro import *
#setting the output
output = output(
output_formats = ['png'],
output_name = "map_step5",
output_name_first_page_number = "off"
)
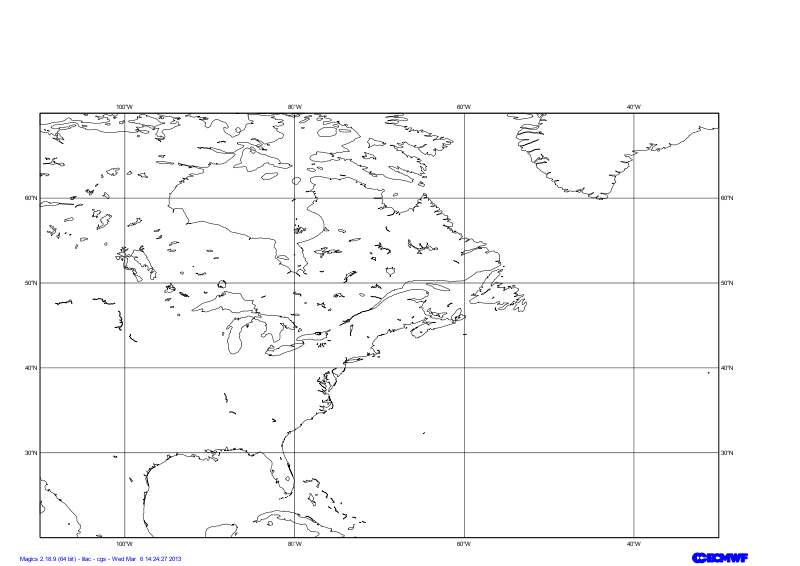
#settings of the geographical area
area = mmap(subpage_map_projection="cylindrical",
subpage_lower_left_longitude=-110.,
subpage_lower_left_latitude=20.,
subpage_upper_right_longitude=-30.,
subpage_upper_right_latitude=70.,
)
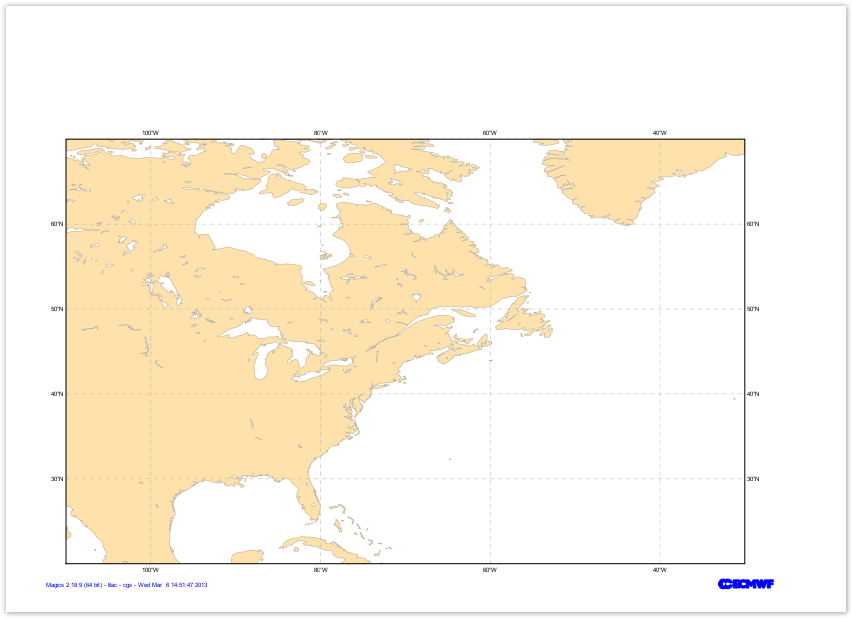
#settings of the caostlines
coast = mcoast(map_coastline_land_shade = "on",
map_coastline_land_shade_colour = "cream",
map_grid_line_style = "dash",
map_grid_colour = "grey",
map_label = "on",
map_coastline_colour = "grey")
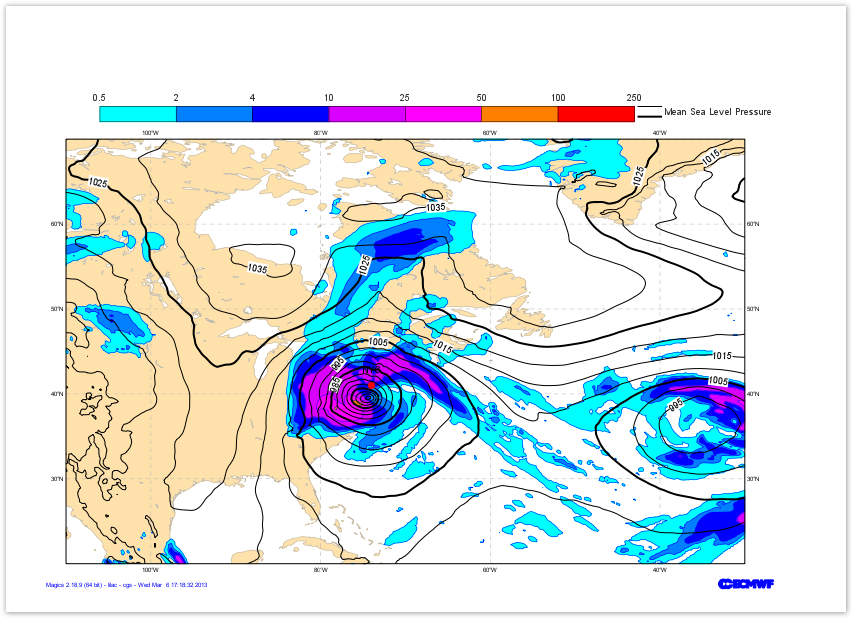
#definition of the input data
precip = mgrib(grib_input_file_name="precip.grib",
grib_automatic_scaling='off',
grib_scaling_factor=1000.)
#definition of shading
shading = mcont( contour_highlight= "off",
contour_hilo= "off",
contour_label="off",
contour_level_list=[0.5, 2., 4., 10., 25., 50., 100., 250.],
contour_level_selection_type= "level_list",
contour_shade= "on",
contour_shade_method= "area_fill",
contour_shade_colour_method= "list",
contour_shade_colour_list= ["cyan", "greenish_blue", "blue", "bluish_purple", "magenta", "orange", "red", "charcoal"],
legend="on")
#definition of msl
msl = mgrib(grib_input_file_name="msl.grib")
#Definition of the black contouring
contour = mcont( contour_highlight_colour= "black",
contour_highlight_thickness= 4,
contour_hilo= "off",
contour_interval= 5.,
contour_label= "on",
contour_label_frequency= 2,
contour_label_height= 0.4,
contour_legend_text= "Mean Sea Level Pressure",
contour_level_selection_type= "interval",
contour_line_colour= "black",
contour_line_thickness= 2,
legend='on'
)
#Definition of the legend
legend = mlegend(legend='on',
legend_display_type='continuous',
legend_text_colour='charcoal',
legend_text_font_size=0.4,
)
plot(output, area, coast, precip, shading, msl, contour, legend) |