...
| Section |
|---|
| Column |
|---|
| | Info |
|---|
|
| Useful axis parameters |
|---|
axis_type | | axis_tick_label_height | | axis_tick_label_colour | | axis_grid | | axis_title |
|
| Code Block |
|---|
| theme | Confluence |
|---|
| language | python |
|---|
| title | Python - Setting a projectionadjusting the axis |
|---|
| collapse | true |
|---|
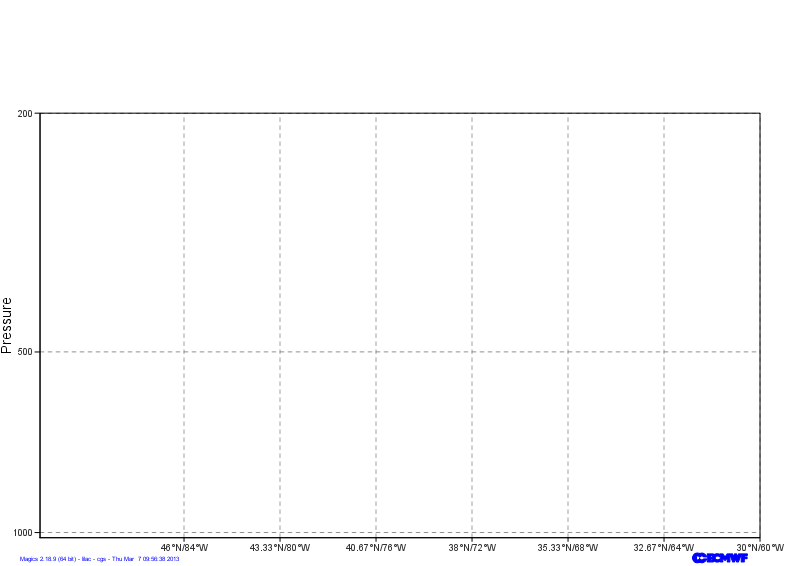
| from Magics.macro import *
#setting the output
output = output(
output_formats = ['png'],
output_name = "xsect_step2",
output_name_first_page_number = "off"
)
# Setting the cartesian view
projection = mmap(
subpage_map_projection='cartesian',
subpage_x_axis_type='geoline',
subpage_y_axis_type='logarithmic',
subpage_x_min_latitude=50.,
subpage_x_max_latitude=30.,
subpage_x_min_longitude=-90.,
subpage_x_max_longitude=-60.,
subpage_y_min=1020.,
subpage_y_max=200.,
)
# Vertical axis
vertical = maxis(
axis_orientation='vertical',
axis_grid='on',
axis_type='logarithmic',
axis_tick_label_height=0.4,
axis_tick_label_colour='charcoal',
axis_grid_colour='charcoal',
axis_grid_line_style='dash',
axis_title='on',
axis_title_text='Pressure',
axis_title_height=0.6,
)
# Horizontal axis
horizontal = maxis(
axis_orientation='horizontal',
axis_type='geoline',
axis_tick_label_height=0.4,
axis_tick_label_colour='charcoal',
axis_grid='on',
axis_grid_colour='charcoal',
axis_grid_thickness=1,
axis_grid_line_style='dash',
)
plot(output, projection, horizontal, vertical) |
|
| Column |
|---|
| 
|
|
...
We want to display the variable p1382012103000000000000, and inform Magics that the dimensions of th ematrix are described in the 2 variables levels and longitude.
The range of the vorticity values is quite small, then we would like to apply a scaling factor of 100000.
We will then just apply a basic contouring.
| Section |
|---|
| Column |
|---|
| | Info |
|---|
|
| Useful Netcdf parameters |
|---|
netcdf_filename | | netcdf_value_variable | | netcdf_field_scaling_factor | | netcdf_y_variable | | netcdf_x_variable | | netcdf_x_auxiliary_variable |
|
| Code Block |
|---|
| theme | Confluence |
|---|
| language | python |
|---|
| title | Python - Loading a Netcdf |
|---|
| collapse | true |
|---|
| from Magics.macro import *
#setting the output
output = output(
output_formats = ['png'],
output_name = "xsect_step3",
output_name_first_page_number = "off"
)
# Setting the cartesian view
projection = mmap(
subpage_map_projection='cartesian',
subpage_x_axis_type='geoline',
subpage_y_axis_type='logarithmic',
subpage_x_min_latitude=50.,
subpage_x_max_latitude=30.,
subpage_x_min_longitude=-90.,
subpage_x_max_longitude=-60.,
subpage_y_min=1020.,
subpage_y_max=200.,
)
# Vertical axis
vertical = maxis(
axis_orientation='vertical',
axis_grid='on',
axis_type='logarithmic',
axis_tick_label_height=0.4,
axis_tick_label_colour='charcoal',
axis_grid_colour='charcoal',
axis_grid_thickness=1,
axis_grid_reference_line_style='solid',
axis_grid_reference_thickness=1,
axis_grid_line_style='dash',
axis_title='on',
axis_title_text='Pressure',
axis_title_height=0.6,
)
# Horizontal axis
horizontal = maxis(
axis_orientation='horizontal',
axis_type='geoline',
axis_tick_label_height=0.4,
axis_tick_label_colour='charcoal',
axis_grid='on',
axis_grid_colour='charcoal',
axis_grid_thickness=1,
axis_grid_line_style='dash',
)
# Definition of the Netcdf data and interpretation
data = mnetcdf(netcdf_filename = "section. |
|
|
...
nc",
      netcdf_value_variable = "p13820121030000000000001",
      netcdf_field_scaling_factor = 100000.,
      netcdf_y_variable = "levels",
      netcdf_x_variable = "longitude",
      netcdf_x_auxiliary_variable = "latitude"
    )
contour = mcont()
plot(output, projection, horizontal, vertical, data, contour) |
|
| Column |
|---|
| 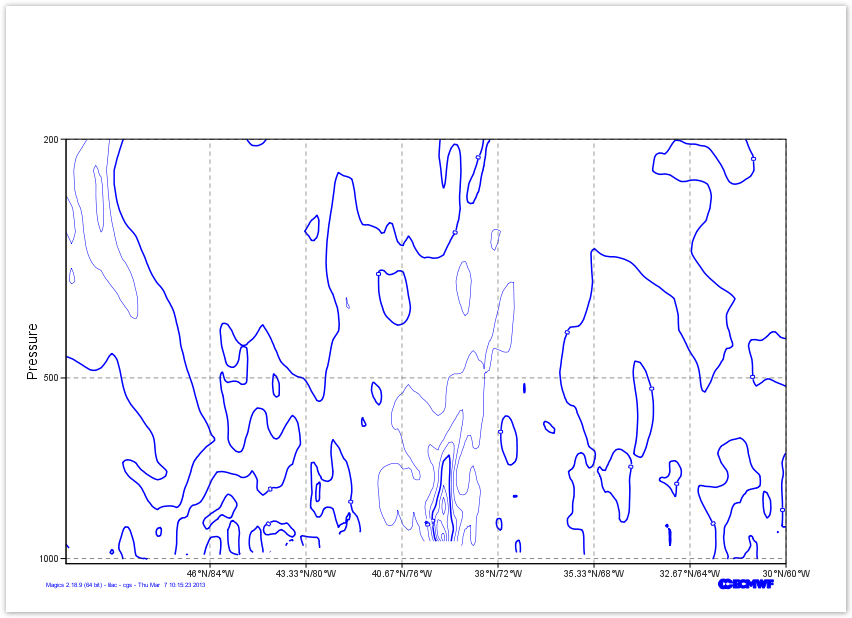 Image Added Image Added
|
|
...