changes.mady.by.user Sylvie Lamy-Thepaut
Saved on Mar 07, 2013
Objectives of the tutorial
At the end of this tutorial, you will be able to:
load grib, netcdf, or simple ascii data
Quick Links
Hello World
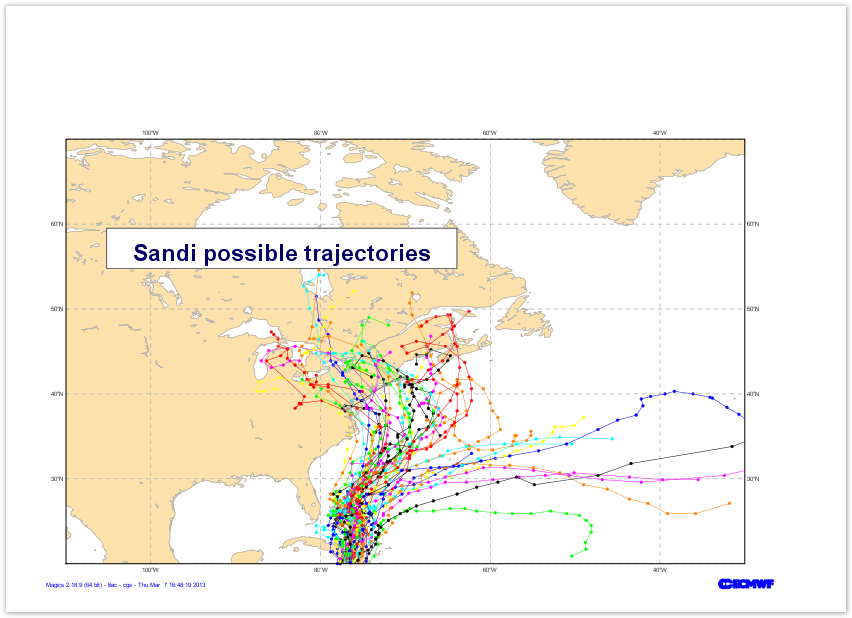
A Geographical Map
A Cross Section
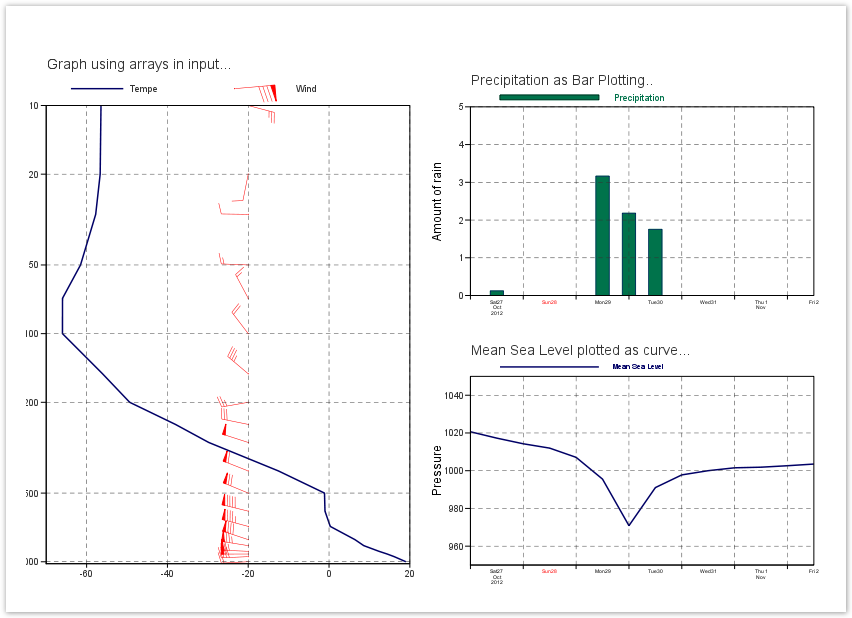
Vertical Profile and time series
More on Symbol Plotting
In short, once you have realised this plot, you will have understood and used the main concepts of Magic
...
Setup a date coordnate system.
Learn how to
Go to Tutorial...
Image Added