| Page info | ||||||
|---|---|---|---|---|---|---|
|
| Info | ||||
|---|---|---|---|---|
| ||||
|
Introduction
A scientific evaluation of the worldwide CORDEX dataset and some selected CMIP5/CMIP6 data for Europe is shown in this page. The main goal is to provide homogeneous information across the different CORDEX domains and regions.Guidance
The two evaluation products (diagnostics and validation) are defined below, along with the list of evaluated and reference datasets.Products:
- Diagnostics: statistics obtained directly from model data providing a graphical overview suitable to identify anomalous values and/or outliers in the data and/or models that deviate from the other available simulations.
Validation: indices comparing model data to reference observations to provide objective measures of model performance. This also provides information on the merits and limitations of the simulations.
The evaluated datasets:
- Worldwide CORDEX model data including all CORDEX domains except the Mediterranean.
- Some selected global CMIP5 model data.
- Some selected global CMIP6 model data.
The reference datasets for the validation:
- ERA5 global reanalysis (Hersbach et al., 2020)
- WFDE bias adjusted version of ERA5 (Cucchi et al., 2020)
The main elements of the plots:
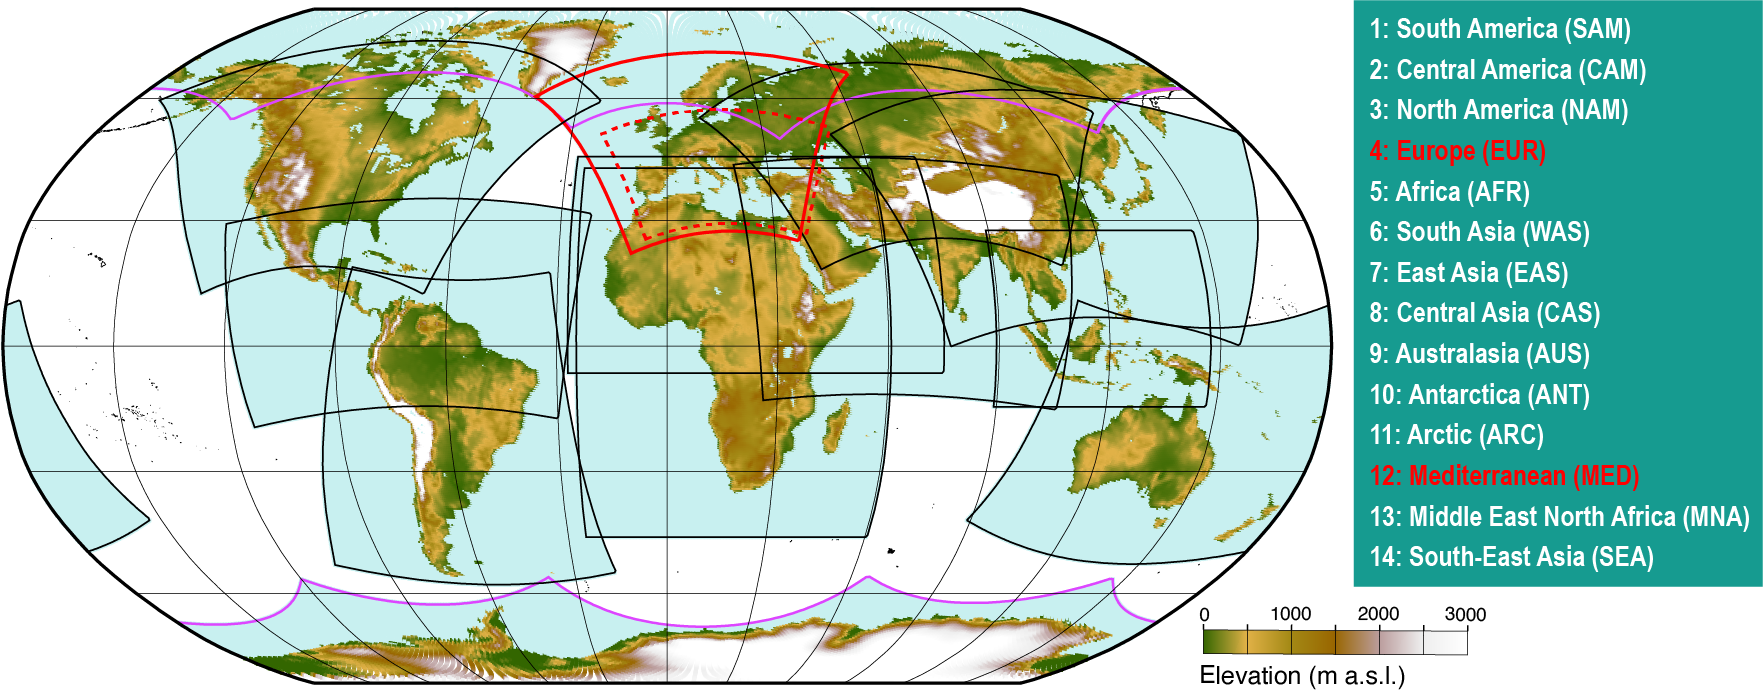
Domain: CORDEX domains are regions for which the regional downscaling is taking place, for example African domain (AFR) covers the whole of the African continent. Note that the Mediterranean domain is not included in the analysis.
Region: Reference regions correspond to climatic sub-areas where the results are aggregated (Iturbide et al. 2020). Here the last version (v4) of the reference regions is used.
Variable: available climatic variables are: tas (mean near-surface air temperature, units: K); pr (precipitation, units: kg m-2 s-1); tasmax (maximum near-surface air temperature, units: K); tasmin (minimum near-surface air temperature, units: K); sfcWind (near-surface wind speed, units: m s-1) and huss (near-surface specific humidity, units: 1).
Metric: some metrics are calculated which characterize various aspects/dimensions which are relevant for practical applications (e.g. mean value, dry spells, or 98th percentile). These are built on the VALUE initiative.
Scenario: scenarios available are: Evaluation (model simulations for the past with imposed "perfect" lateral boundary condition using ERA-Interim reanalysis); Historical (model simulations for the past using lateral boundary conditions from CMIP5 simulations under the historical scenario); experiments RCP 2.6, RCP 4.5 and RCP 8.5 (simulations driven by boundary conditions from CMIP5 scenario projections using RCP (Representative Concentration Pathways) forcing scenarios; experiments SSP1-2.6, SSP2-4.5 and SSP5-8.5 simulations for CMIP6 scenario projections using the SSP (Shared Socioeconomic Pathway) forcing scenarios.
Index: period where the CMIP6 delta changes (difference between the future and past simulations) are calculated for Europe (medium-term and long-term periods correspond to the periods 2036-2065 and 2070-2099 respectively, the past reference period is 1981-2010).
More information about the details of the plots and their interpretation, please see at CORDEX: Regional climate projections - Background documents and user guides
Particularly, please refer to documents 1, 9, 10 and 11.
Evaluation results
| HTML |
|---|
    <link href="https://cdn.jsdelivr.net/npm/bootstrap@5.0.2/dist/css/bootstrap.min.css" rel="stylesheet" integrity="sha384-EVSTQN3/azprG1Anm3QDgpJLIm9Nao0Yz1ztcQTwFspd3yD65VohhpuuCOmLASjC" crossorigin="anonymous">
    <link rel="stylesheet" media="all" href="//fonts.googleapis.com/css?family=Open+Sans" />

    <title>C3S_34d</title>

    <!-- <script src="https://cdnjs.cloudflare.com/ajax/libs/jquery/3.6.0/jquery.min.js" integrity="sha512-894YE6QWD5I59HgZOGReFYm4dnWc1Qt5NtvYSaNcOP+u1T9qYdvdihz0PPSiiqn/+/3e7Jo4EaG7TubfWGUrMQ==" crossorigin="anonymous" referrerpolicy="no-referrer"></script> -->
    <script src="https://cdn.jsdelivr.net/npm/bootstrap@5.0.2/dist/js/bootstrap.bundle.min.js" integrity="sha384-MrcW6ZMFYlzcLA8Nl+NtUVF0sA7MsXsP1UyJoMp4YLEuNSfAP+JcXn/tWtIaxVXM" crossorigin="anonymous"></script>

    <style>
		/* if embedding this content in conlfuence it might be worth considering replacing the bootstrap css with manual css because having both the bootstrap css and confluence css causes issues */
		/* some of these issues are fixed in the lines below, but not all, for example the font and size of the confluence parts of the screen are differnt on this page than other confluence pages, most noticeably the logo  */
		/*body{padding:20px;}*/ /*not needed in confluence; main-content added to next classes to contain the effect of the css to content within this are of the screen */
		#main-content .tab-pane{padding:20px 0;font-size:1.2em;}
		#main-content label{padding:0 10px 0 20px;}
		#main-content img{max-width:100%;padding:20px 0;}
		#main-content ul.nav.nav-tabs{list-style-type: none;} /*to override bullets in confluence*/
		a{text-decoration: none;} /* to resolve clash between code in this macro and confluence code which was causing links to be underlined*/
    </style>

    <script src="https://sites.ecmwf.int/daah/climproj/index.js"></script>

    <ul class="nav nav-tabs" id="tabs" role="tablist">
	  <li class="nav-item">
		<a class="nav-link active" id="diagnostic-tab" data-toggle="tab" href="#cordex" role="tab" aria-controls="home" aria-selected="true">CORDEX</a>
	  </li>
	  <li class="nav-item">
		<a class="nav-link" id="profile-tab" data-toggle="tab" href="#cmip" role="tab" aria-controls="profile" aria-selected="false">CMIP</a>
	  </li>
	</ul>

    <div class="tab-content" id="nav-tabContent">
	  <div class="tab-pane fade show active" id="cordex" role="tabpanel" aria-labelledby="cordex-tab">
	    <ul class="nav nav-tabs" id="tabs-1" role="tablist">
	      <li class="nav-item">
	    	<a class="nav-link active" id="diagnostic-tab" data-toggle="tab" href="#diagnostic" role="tab" aria-controls="home" aria-selected="true">Diagnostics</a>
	      </li>
	      <li class="nav-item">
	    	<a class="nav-link" id="evaluation-tab" data-toggle="tab" href="#evaluation" role="tab" aria-controls="evaluation" aria-selected="false">Validation</a>
	      </li>
	    </ul>
	    <div class="tab-content" id="nav-tabContent">
	      <div class="tab-pane fade show active" id="diagnostic" role="tabpanel" aria-labelledby="diagnostic-tab">
	    	<label for="diagnostic-domain">Domain: </label><select id="diagnostic-domain"></select>
	    	<label for="diagnostic-variable">Variable: </label><select id="diagnostic-variable"></select>
	    	<label for="diagnostic-scenario">Scenario: </label><select id="diagnostic-scenario"></select><br/>
	    	<img id="diagnostic-img"/><br/>
	    	<div>Climate stripes showing the time series of annual spatially aggregated values over the whole <a href="https://sites.ecmwf.int/daah/climproj/other_figures/CORDEX_domains.png" target="_blank">CORDEX domain</a> (in columns) for the different available RCM simulations (in rows). Note that the colour bar range for some figures was narrowed to omit outliers, different variable units and abnormal behaviours. See the guidance above for more information on the interpretation of the presented plots.</div>
	      </div>
	      <div class="tab-pane fade" id="evaluation" role="tabpanel" aria-labelledby="evaluation-tab">
            <label for="evaluation-domain">Domain: </label><select id="evaluation-domain"></select>
	    	<label for="evaluation-variable">Variable: </label><select id="evaluation-variable"></select>
	    	<label for="evaluation-metric">Metric: </label><select id="evaluation-metric"></select><br/>
	    	<img id="evaluation-img"/><br/>
	    	<div>Reanalysis driven (left block) and the GCM-driven (right block) simulations. The GCMs are represented in magenta, with all RCMs (in black) driven by the preceding GCM. Each cell shows the biases corresponding to the annual (central), boreal summer/JJA (upper-left corner), and boreal winter (lower-right corner) values. The rows display results for different <a href="https://sites.ecmwf.int/daah/climproj/other_figures/reference_regions.pdf" target="_blank">Reference regions</a>. <a href="https://sites.ecmwf.int/daah/climproj/other_figures/metrics.pdf" target="_blank">Metrics</a> are defined following the VALUE initiative. See the guidance above for more information on the interpretation of the presented plots.</div>
	      </div>
	    </div>
	  </div>
	  <div class="tab-pane fade show" id="cmip" role="tabpanel" aria-labelledby="cmip-tab">
	    <ul class="nav nav-tabs" id="tabs-2" role="tablist">
	      <li class="nav-item">
	    	<a class="nav-link active" id="cmip-diagnostic-tab" data-toggle="tab" href="#cmip-diagnostic" role="tab" aria-controls="home" aria-selected="true">Diagnostics</a>
	      </li>
	      <li class="nav-item">
	    	<a class="nav-link" id="cmip-evaluation-tab" data-toggle="tab" href="#cmip-evaluation" role="tab" aria-controls="evaluation" aria-selected="false">Validation</a>
	      </li>
	    </ul>
 	    <div class="tab-content" id="nav-tabContent">
	  	  <div class="tab-pane fade show active" id="cmip-diagnostic" role="tabpanel" aria-labelledby="cmip-diagnostic-tab">
	        <label for="cmip-diagnostic-region">Region: </label><select id="cmip-diagnostic-region"></select>
            <label for="cmip-diagnostic-gcm">GCMs/CMIP: </label><select id="cmip-diagnostic-gcm"></select>
	    	<label for="cmip-diagnostic-variable">Variable: </label><select id="cmip-diagnostic-variable"></select>
	    	<label for="cmip-diagnostic-index">Index: </label><select id="cmip-diagnostic-index"></select><br/>
	    	<img id="cmip-diagnostic-img"/><br/>
	    	<div>Heat maps, showing diagnostics (future climate change) for CMIP5 (models used for EURO-CORDEX as boundary conditions are highlighted in red) and CMIP6. Results are aggregated in the <a href="https://sites.ecmwf.int/daah/climproj/other_figures/reference_regions.pdf" target="_blank">reference regions</a> version v4. See the guidance above for more information on the interpretation of the presented plots.</div>
	      </div>
	  	  <div class="tab-pane fade" id="cmip-evaluation" role="tabpanel" aria-labelledby="cmip-evaluation-tab">
	        <label for="cmip-evaluation-region">Region: </label><select id="cmip-evaluation-region"></select>
            <label for="cmip-evaluation-gcm">GCMs/CMIP: </label><select id="cmip-evaluation-gcm"></select>
	    	<label for="cmip-evaluation-variable">Variable: </label><select id="cmip-evaluation-variable"></select>
	    	<label for="cmip-evaluation-metric">Metric: </label><select id="cmip-evaluation-metric"></select><br/>
	    	<img id="cmip-evaluation-img"/><br/>
	    	<div>Heat maps, showing GCM validation (biases)	 for CMIP5 (models used for EURO-CORDEX as boundary conditions are highlighted in red) and CMIP6. Results are aggregated in the <a href="https://sites.ecmwf.int/daah/climproj/other_figures/reference_regions.pdf" target="_blank">reference regions</a> version v4. See the guidance above for more information on the interpretation of the presented plots.</div>
	      </div>
	    </div>
	  </div>

	  </div>
	</div>
	<div id="error" class="alert alert-warning" style="display:none"><h3>This variable/metric combination is not available</h3></div>
|
The results have been developed in the framework of the C3S contracts C3S_34d and C3S_34b Lot 2. For the CMIP plots, see more details at Katharina Bülow and Ludwig Lierhammer (2022): cmip5 cmip6 euro-cordex plotting routines and data: v0.1.0 (v0.1.0). Zenodo, https://doi.org/10.5281/zenodo.5925641
References
Cucchi, M., Weedon, G. P., Amici, A., Bellouin, N., Lange, S., Müller Schmied, H., Hersbach, H., and Buontempo, C., 2020: WFDE5: bias-adjusted ERA5 reanalysis data for impact studies, Earth Syst. Sci. Data, 12, 2097–2120, https://doi.org/10.5194/essd-12-2097-2020.
, and Coauthors, 2020: The ERA5 global reanalysis Quart. J. Roy. Meteor. Soc., 146, 1999– 2049. https://doi.org/10.1002/qj.3803.
Iturbide, M., and Coauthors, 2020: An update of IPCC climate reference regions for subcontinental analysis of climate model data: definition and aggregated datasets, Earth Syst. Sci. Data, 12, 2959–2970, https://doi.org/10.5194/essd-12-2959-2020.
, , & 2019: Statistical downscaling skill under present climate conditions: A synthesis of the VALUE perfect predictor experiment. International Journal of Climatology, 9, 3692– 3703, https://doi.org/10.1002/joc.5877.
| Info | |
|---|---|
| false | This document has been produced in the context of the Copernicus Climate Change Service (C3S). The activities leading to these results have been contracted by the European Centre for Medium-Range Weather Forecasts, operator of C3S on behalf of the European Union (Delegation agreement signed on 11/11/2014). All information in this document is provided "as is" and no guarantee or warranty is given that the information is fit for any particular purpose. The users thereof use the information at their sole risk and liability. For the avoidance of all doubt , the European Commission and the European Centre for Medium - Range Weather Forecasts have no liability in respect of this document, which is merely representing the author's view. |
Related articles
| Content by Label | ||||||||||||||||||
|---|---|---|---|---|---|---|---|---|---|---|---|---|---|---|---|---|---|---|
|