...
The generation of the sub-seasonal and seasonal forecast signal relies on few major steps, illustrated by a flowchart in Figure 1. The forecast anomaly and uncertainty signals are derived by comparing the real time forecast (top left section in Figure 1) to the 99-value percentile climatology. The climatology is generated using reforecasts over a 20-year period, which provides range-dependent climate percentiles that change with the lead time. The climate generation is described in the bottom right left corner of Figure 1.
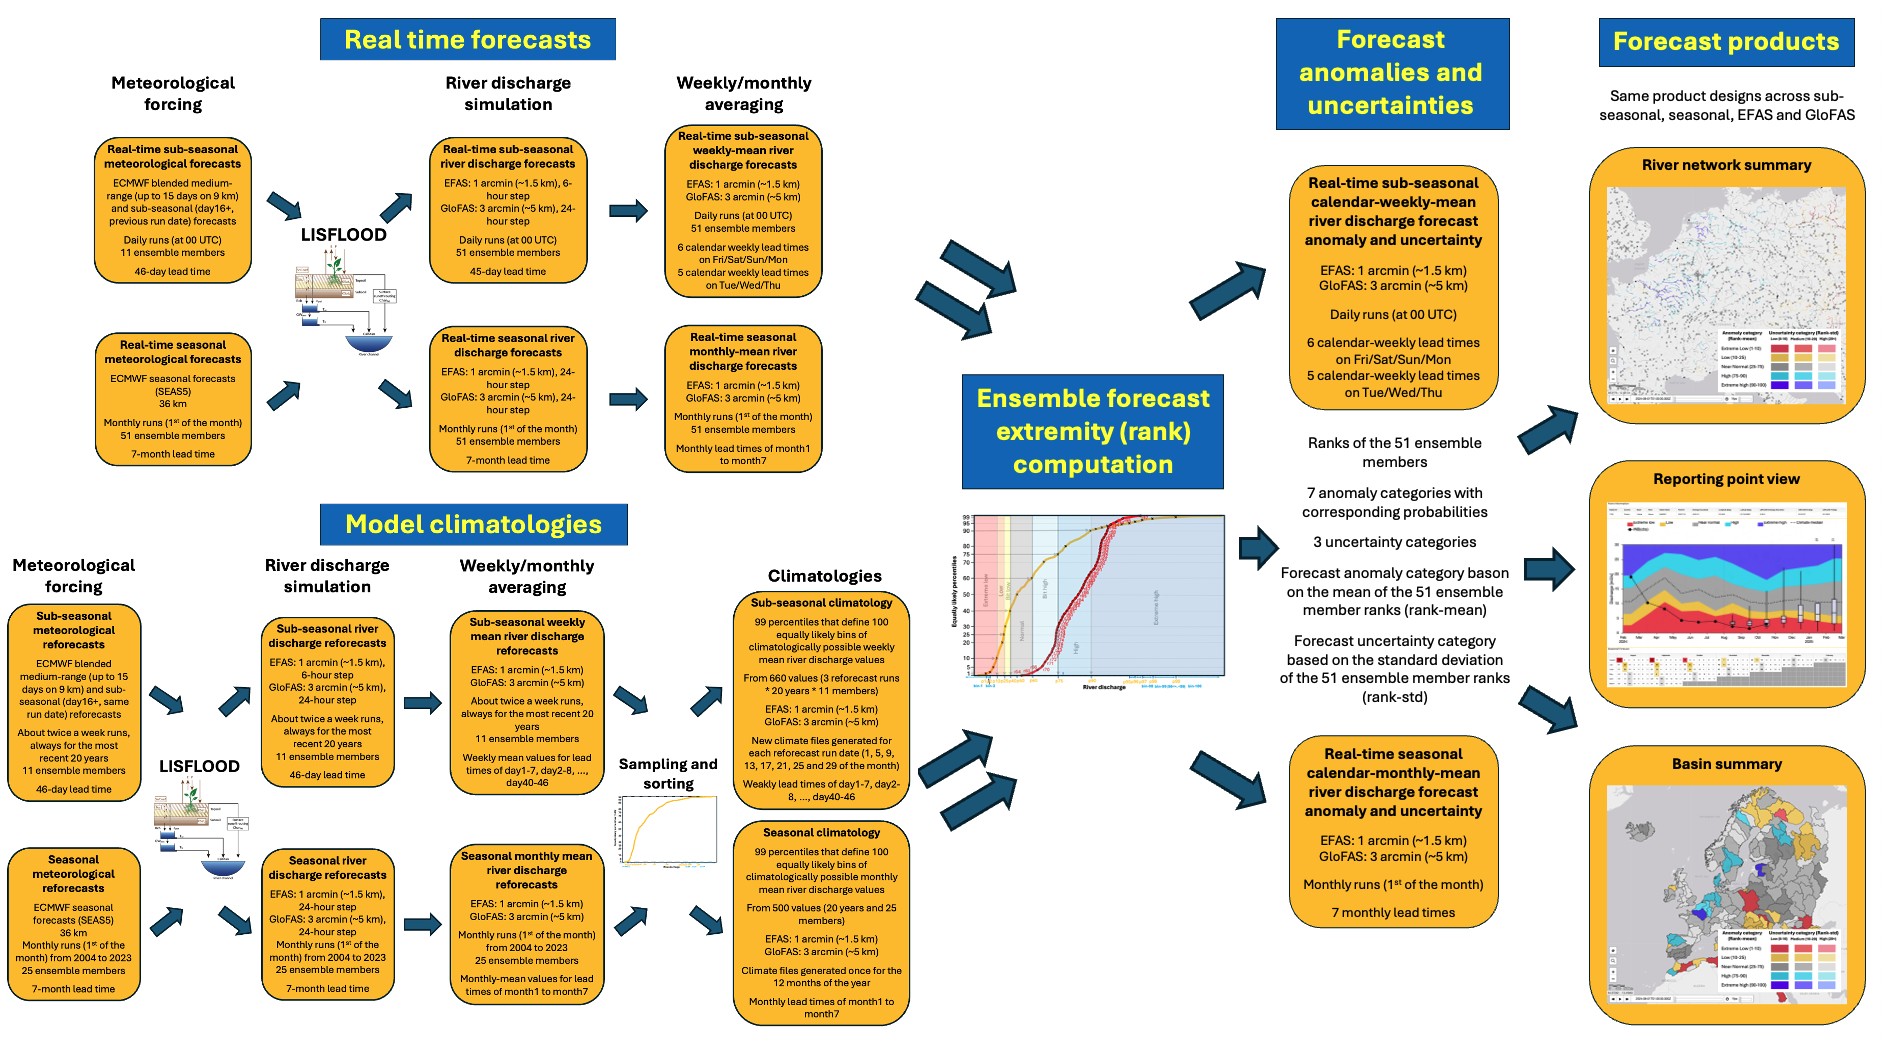
Figure 1. Flowchart of the sub-seasonal and seasonal anomaly and uncertainty signal generation methodology.
...