...
If you have queries and have read the documentation, please contact Robin Hogan.
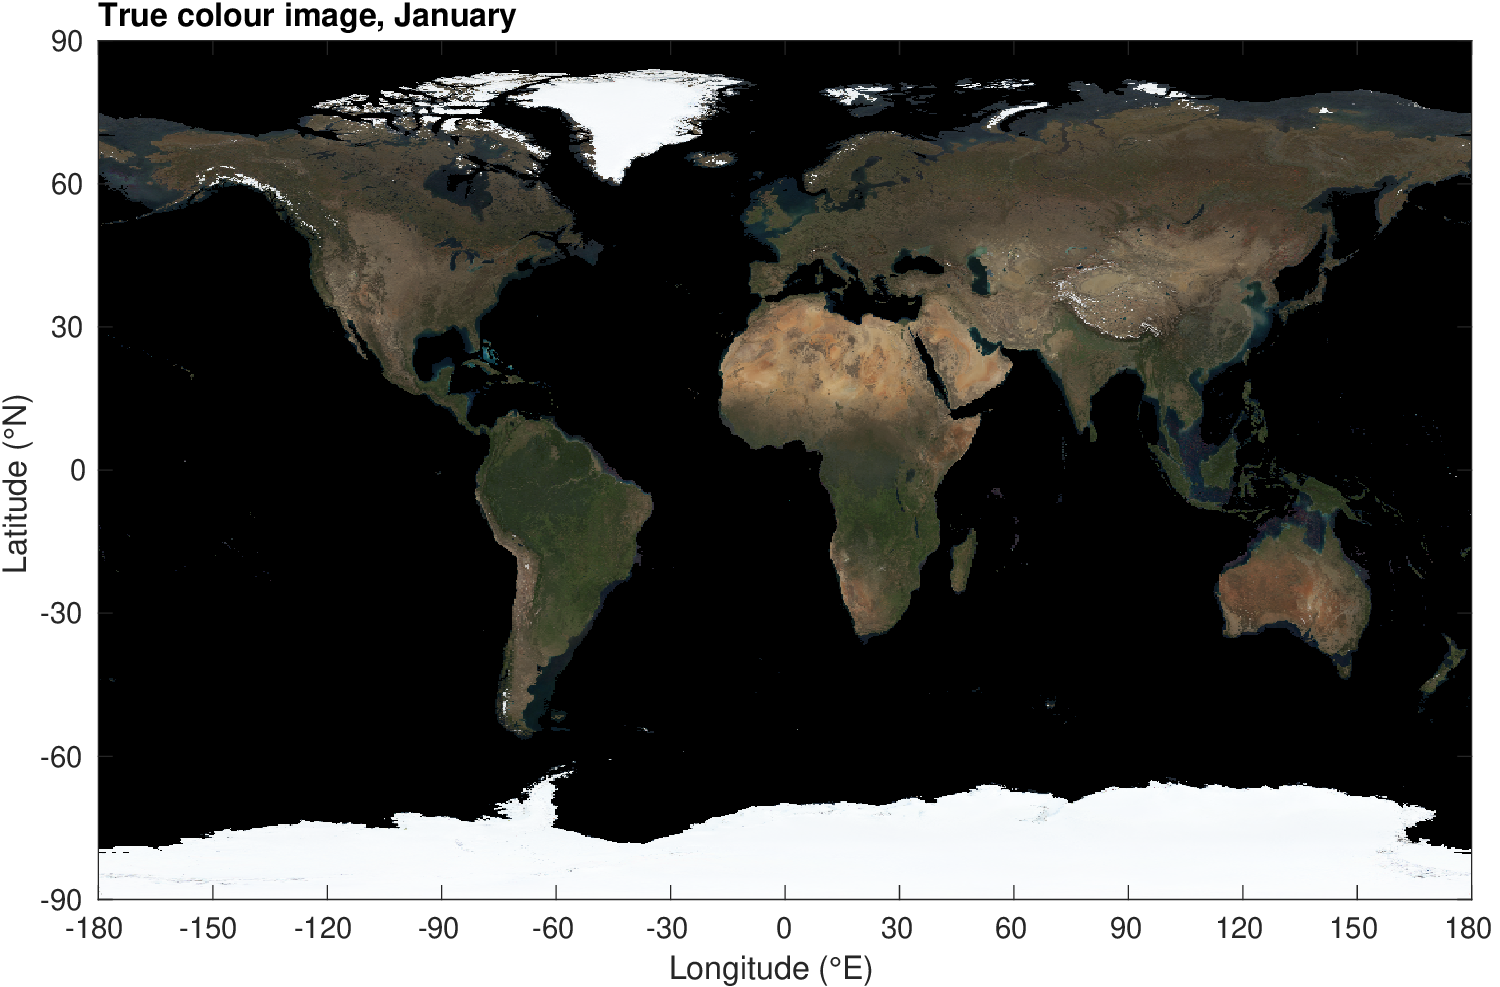
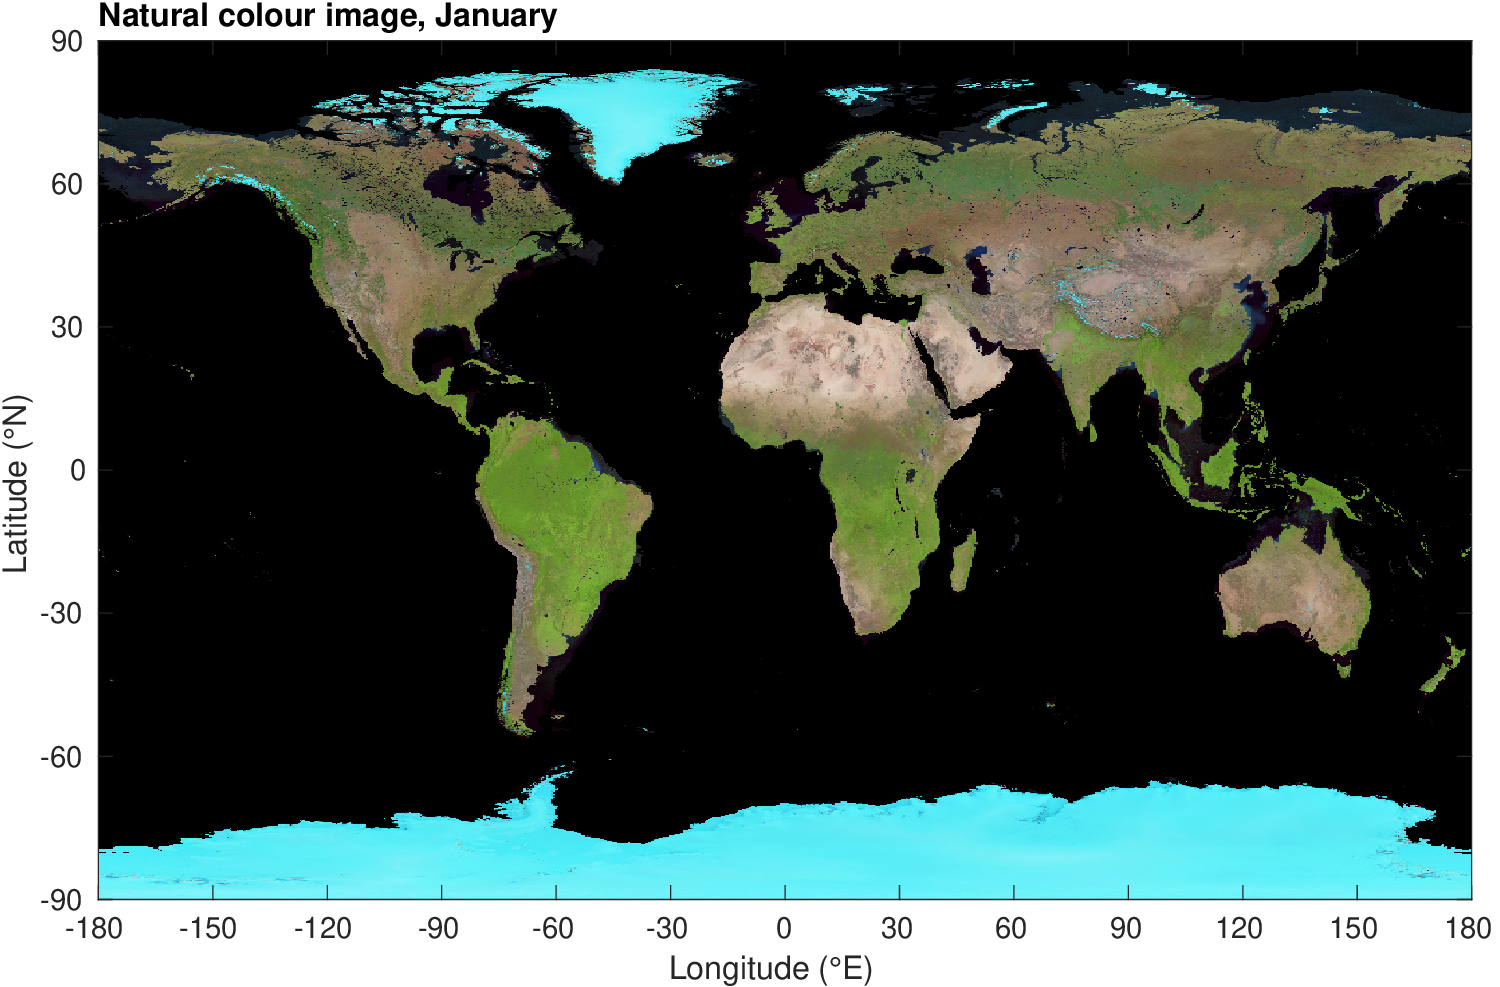
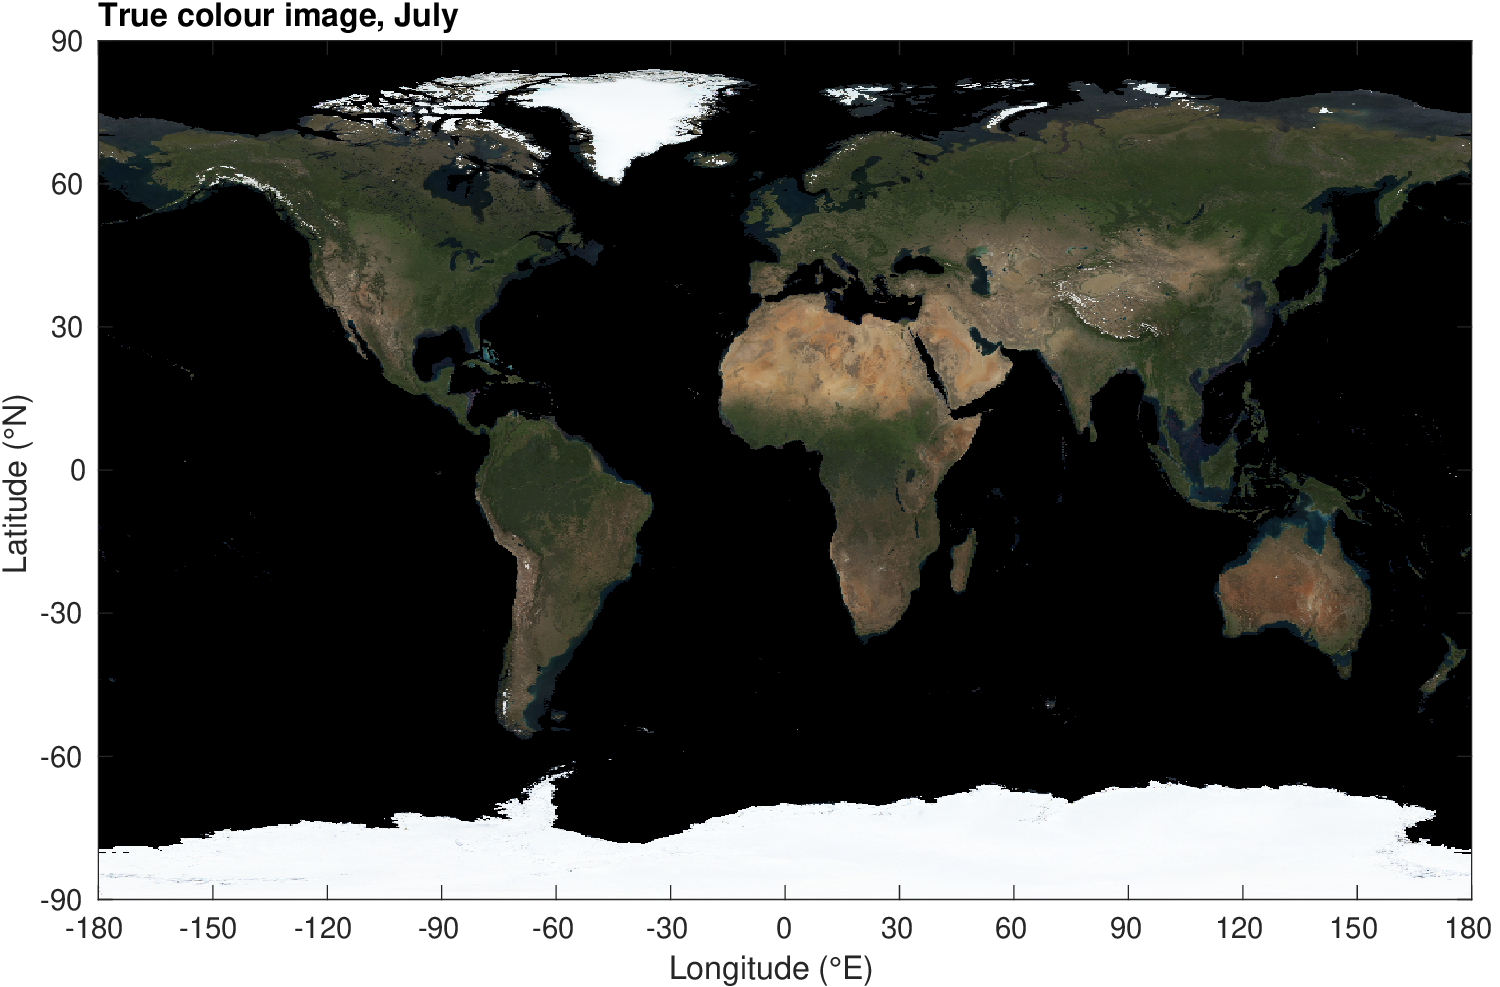
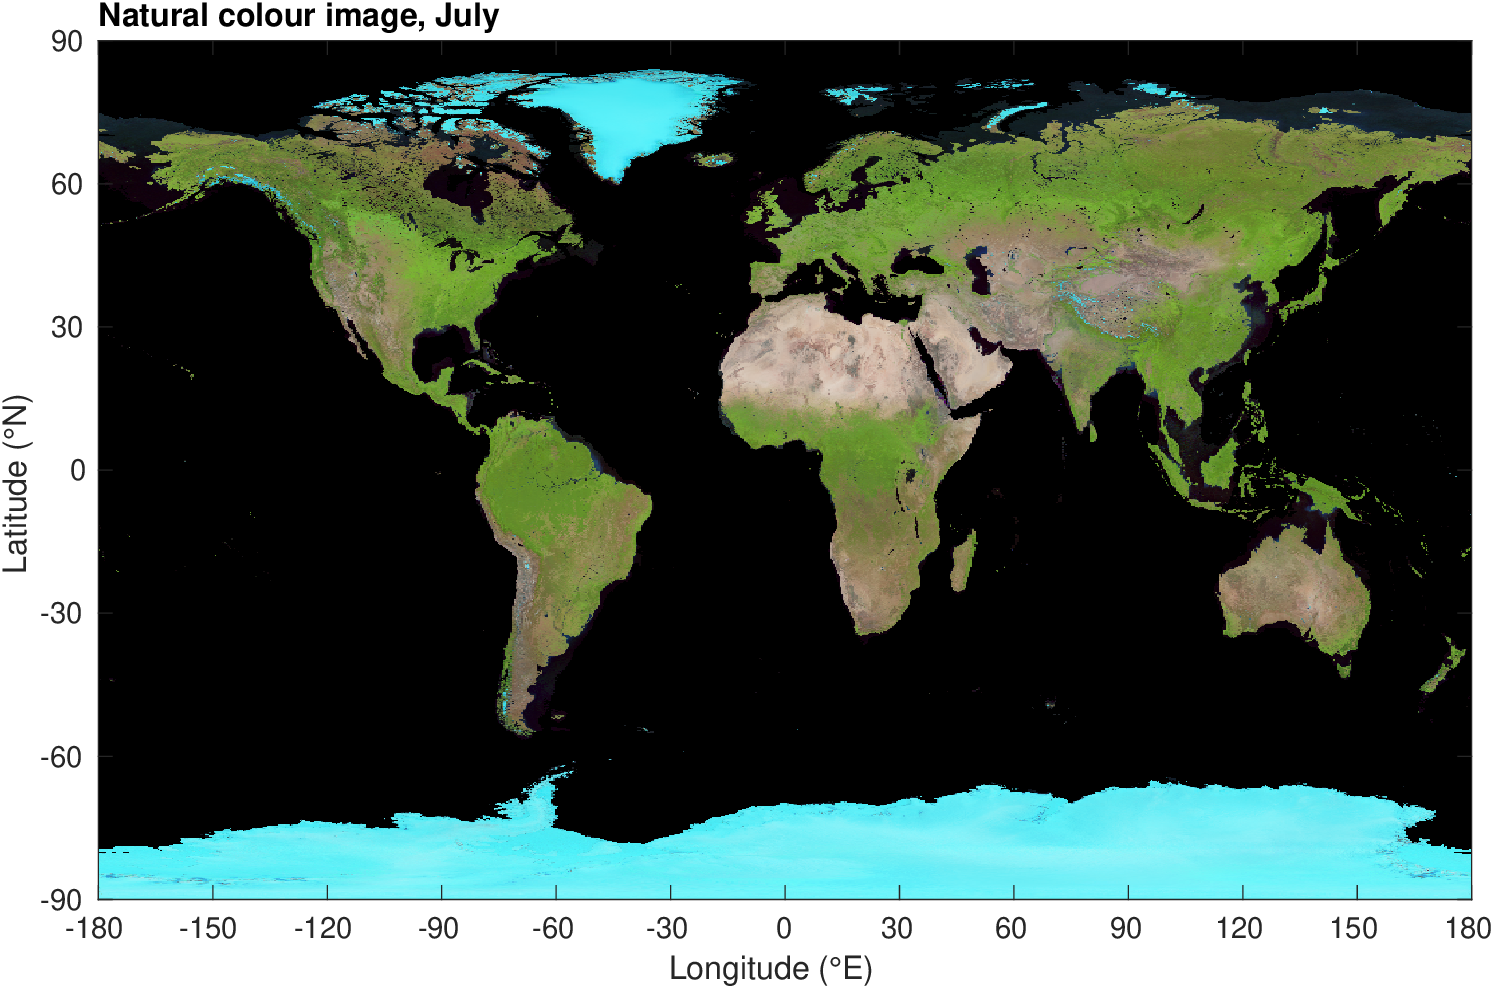
The left panels below show the climatological white-sky albedo in MODIS’s red, green and blue bands (bands 1, 4 and 3, centred at 645, 555 and 469 nm, respectively) for January and July. The right panels show the same but with the “natural colour” choice of wavelengths that exploits the near-infrared bands to bring out the different land-surface types more clearly; for red, green and blue we use bands 6, 2 and 1, centred at 1640, 859 and 645 nm, respectively. Missing data over deep oceans are rendered in black. The square-root of the actual values has been plotted to account for the gamma correction of a typical display.