The Layers tabThe image on the right shows a Metview Display Window with two data fields plotted, each with its own Contouring icon, plus a custom Text Plotting icon for the title. The Layers tab of the sidebar is open. We will use this as an example We'll look at the Display Level and the View Level sections in a moment, but for now look at the Plot Level section. This contains all the layers of the plot - they can be re-ordered by dragging each layer up or down, or by clicking on the up and down arrows at the bottom. Their transparency level can also be set using the slider at the bottom. Changing the layer order and transparencyThe Plot Level section contains all the layers of the plot - they can be re-ordered by dragging each layer up or down, or by clicking on the up and down arrows at the bottom. Their transparency level can also be set using the slider at the bottom. Changing the visdefs applied to a particular data itemNew visdef icons can be applied to a data item by dropping them directly onto that item's Normally, when a visdef icon is dropped into a Display Window, it is applied to all data layers for which it is valid. If you want to apply a visdef to just one data layer, you can drop it onto that specific layer in the Plot Level section. These will replace any visdefs currently applied to that dataA tip will appear to confirm which layer it will be applied to. Single or multiple visdef icons can be applied in this way, and will replace any visdefs currently applied to that data. 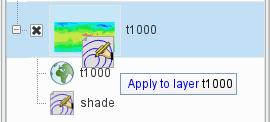
Visdef icons currently applied to a data item can also be edited directly from here - double-click on the visdef icon, or right-click | Edit in plot, modify the parameters and click Ok . The changes are applied immediately to the plot. Your changes will not be saved back to the original visdef icon until you choose Save to disk from the context menu for that visdef. From the context menu you can also remove the visdef from its data layer. Changing the visdefs applied to multiple data items in a page/sceneAny visdef icons present in the View Level will be applied to any data items which do not have a visdef directly attached to them. Therefore, first ensure that any data items you want to affect in unison do not have their own visdefs at the Plot Level. Then drop and edit visdef icons in the View Level to affect these items in one go. Icon names with <angular brackets> around them denote the system default visdef; these can be edited, but cannot be saved to disk. If the Display Window contains multiple pages/scenes, check the current selection with the Active Scene control at the top. Changing the visdefs applied to all pages/scenes in the window (e.g. stamp plots)Any visdef icons in the Display Level will be applied to any data items which a) don't have their own visdef attached directly to them, and b) do not inherit any visdefs from their View Level. So if a number of pages have been plotted without any visdefs attached to their data, dropping a visdef icon into the Display Level will cause it to be applied to the data in all these pages. Icon names with <angular brackets> around them denote the system default visdef; these can be edited, but cannot be saved to disk. Inline editing of visual definition iconsLayer t1000 comes from a MARS Retrieval icon called t1000. When the layer tree is expanded we see the data icon plus the visdef icon (shade) that has been applied to it. If we want to change the contouring parameters for this layer, we can edit the shade icon directly in the plot by double-clicking on it (or right-click | Edit in plot). The icon editor for this visdef appears; when you click Ok, the changes are applied immediately to the plot. Your changes will not be saved back to the original visdef icon until you choose Save to disk from the context menu for that visdef. From the context menu you can also remove the visdef from its data layer. Targeting icon dropsNormally, when a visdef icon is dropped into a Display Window, it is applied to all data layers for which it is valid. If you want to apply a visdef to just one data layer, you can drop it onto that specific layer in the Layers tab. A tip will appear to confirm which layer it will be applied to. Single or multiple visdef icons can be applied in this way. Image Removed Levels
Description of the levelsThe Layers tab is divided into three levels, described below. Understanding these levels allows for more sophisticated plot editing. The Plot LevelThis is where the actual plotting layers are shown for the currently-selected view (page). They can be re-ordered, removed, and their visdefs edited. The View LevelThis section shows the icons that are applied to the currently-selected view (page) and are not specific to any particular data layer. Any data layer which does not have a visdef attached directly to it in the Plot Level will take its visdef from here if there is one. The Display LevelThis section shows the icons that are applied to the all the views (pages) and are not specific to any particular view or data layer. Any data layer which does not have a visdef attached directly to it in the Plot Level and does not find one in the View Level will take its visdef from here if there is one. | 