| Panel |
|---|
| title | Visualising ODB in Magics |
|---|
|
There are several ways on visualisating ODB data in Magics. - use the ODB Magics objects. This allows Magics to read a odb file and extract some columns for geographical plots or graph.
- In python, it also possible to use odb_api packages to create a numpy array and pass the values in memeoty to Magics. magics is then able to perform symbol plotting on a geographical area, time series, etc ..
This page will present examples of these different plottings, and will offer skeletons of python programs. |
Using an ODB file and create a geographical map
...
In this example, we will ask Magics to load this ODB file, and plot the position of each observation using the simple marker. WE have to inform Magics about the name of the columns to use to find the latitude, and longitude information.
| Section |
|---|
| Column |
|---|
| 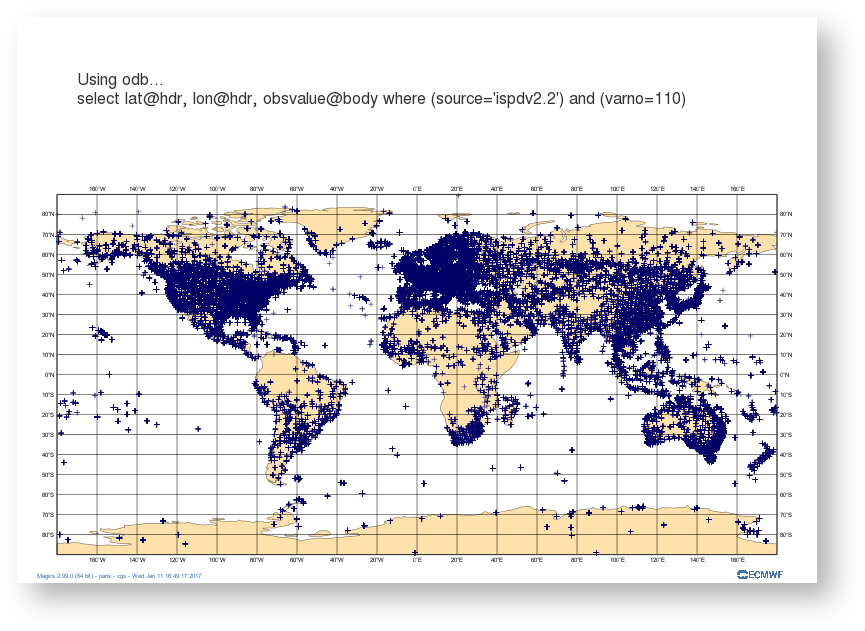 Image Modified Image Modified
|
| Column |
|---|
| | Code Block |
|---|
| language | py |
|---|
| title | Simple symbol plotting |
|---|
| # importing Magics module
from Magics.macro import *
# Setting of the output file name
output = output(output_formats=['png'],
output_name_first_page_number='off',
output_name="odb_step1")
# Background Coastlines
background = mcoast(
map_coastline_sea_shade_colour='white',
map_coastline_land_shade_colour='cream',
map_grid='on',
map_coastline_land_shade='on',
map_coastline_sea_shade='on',
map_label='on',
map_coastline_colour='tan',
)
# Import odb data
odb = odb_geopoints(odb_filename='geo.odb',
odb_latitude_variable='lat@hdr',
odb_longitude_variable='lon@hdr',
)
# Define the symbol plotting
symbol = msymb(symbol_type='marker',
symbol_colour='navy',
symbol_marker_index=3,
symbol_height=0.4,
)
# Add a title
lines = ['Using odb...',
'select lat@hdr, lon@hdr, obsvalue@body where (source='ispdv2.2') and (varno=110)',
]
title = mtext(
text_lines=lines,
text_justification='left',
text_font_size=0.7,
text_colour='charcoal',
)
#Create the plot
plot(output, background, odb, symbol, title)
|
|
|