...
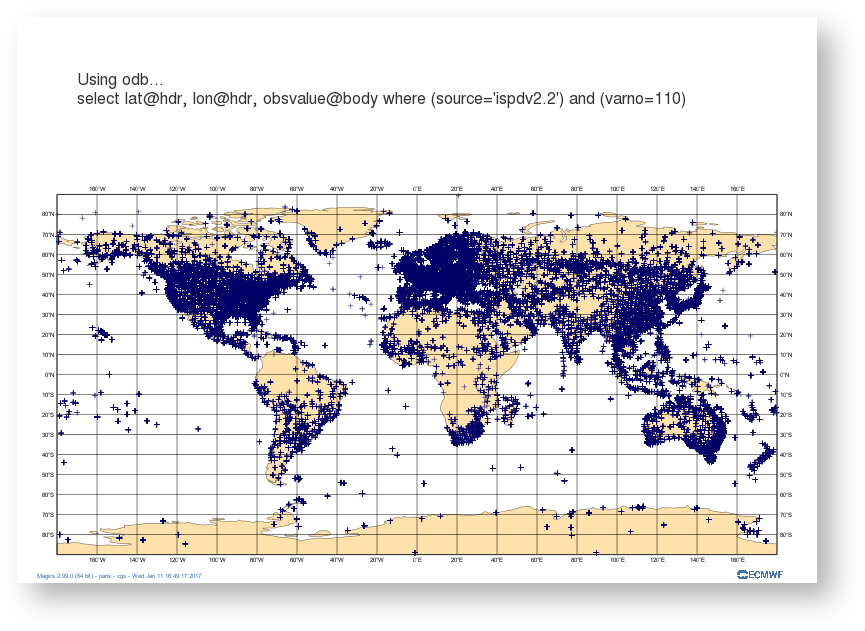
In this example, we will ask Magics to load this ODB file, and plot the position of each observation using the simple marker. WE have to inform Magics about the name of the columns to use to find the latitude, and longitude information.
| Section |
|---|
| Column |
|---|
| 
|
| Column |
|---|
| | Code Block |
|---|
| language | py |
|---|
| title | Simple symbol plotting |
|---|
| collapse | true |
|---|
| # importing Magics module
from Magics.macro import *
# Setting of the output file name
output = output(output_formats=['png'],
output_name_first_page_number='off',
output_name="odb_step1")
# Background Coastlines
background = mcoast(
map_coastline_sea_shade_colour='white',
map_coastline_land_shade_colour='cream',
map_grid='on',
map_coastline_land_shade='on',
map_coastline_sea_shade='on',
map_label='on',
map_coastline_colour='tan',
)
# Import odb data
odb = odb_geopoints(odb_filename='geo.odb',
odb_latitude_variable='lat@hdr',
odb_longitude_variable='lon@hdr',
)
# Define the symbol plotting
symbol = msymb(symbol_type='marker',
symbol_colour='navy',
symbol_marker_index=3,
symbol_height=0.4,
)
# Add a title
lines = ['Using odb...',
'select lat@hdr, lon@hdr, obsvalue@body where (source='ispdv2.2') and (varno=110)',
]
title = mtext(
text_lines=lines,
text_justification='left',
text_font_size=0.7,
text_colour='charcoal',
)
#Create the plot
plot(output, background, odb, symbol, title)
|
|
|
...