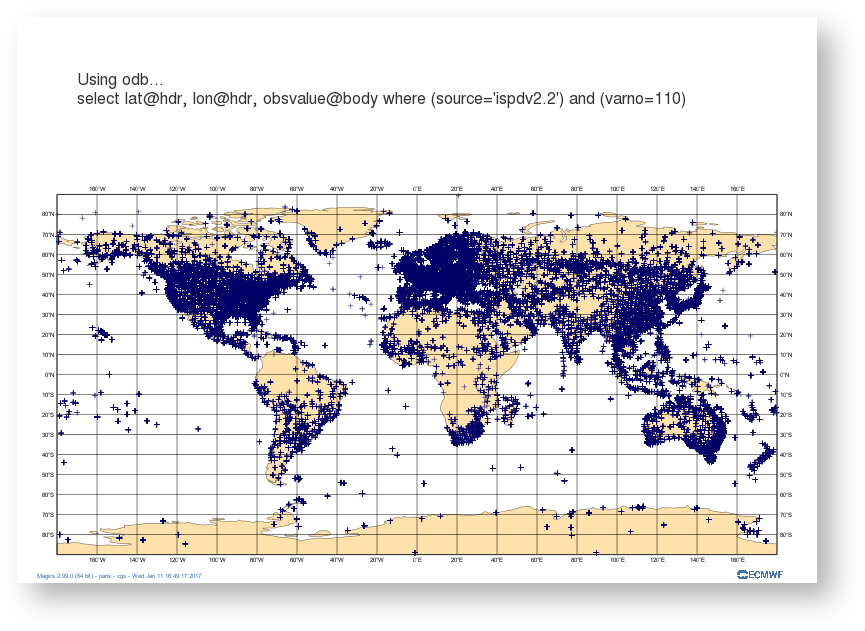
# importing Magics module from Magics.macro import * # Setting of the output file name output = output(output_formats=['png'], output_name_first_page_number='off', output_name='odb_step2') # Background Coastlines background = mcoast( map_coastline_sea_shade_colour='white', map_coastline_land_shade_colour='cream', map_grid='on', map_coastline_land_shade='on', map_coastline_sea_shade='on', map_label='on', map_coastline_colour='tan', ) # Import odb data odb = odb_geopoints(odb_filename='geo.odb', odb_latitude_variable='lat@hdr', odb_longitude_variable='lon@hdr', odb_value_variable='obsvalue@body', ) # Define the symbol plotting symbol = msymb(symbol_type='marker', symbol_colour='navy', symbol_advanced_table_selection_type='list', symbol_advanced_table_level_list=[50000., 75000., 90000., 100000., 100500., 101000., 101500., 102000., 102500., 103000., 103500., 104000., 105000.], symbol_advanced_table_min_level_colour='blue', symbol_advanced_table_max_level_colour='red', symbol_advanced_table_colour_direction='clockwise', symbol_table_mode='advanced', legend='on' ) #Adding some text lines = ['Using odb colouring the symbol according to the value of the observation...', "select lat@hdr, lon@hdr, obsvalue@body where (source='ispdv2.2') and (varno=110)", '<magics_title/>'] title = mtext( text_lines=lines, text_html='true', text_justification='left', text_font_size=0.7, text_colour='charcoal', ) #adding some legend legend = mlegend(legend='on', legend_text_colour='navy', legend_display_type='continuous') #Create the plot plot(output, background, odb, symbol, title,legend) |