Versions Compared

Key

  • This line was added.
  • This line was removed.
  • Formatting was changed.
Panel
titleVisualising ODB in Magics

There are several ways on visualisating ODB data in Magics.

  • use the ODB Magics objects. This allows Magics to read a odb file and extract some columns for geographical plots or graph.
  • In python, it also possible to use odb_api packages to create a numpy array and pass the values in memeoty to Magics. magics is then able to perform symbol plotting on a geographical area, time series, etc .. 

This page will present presents examples of these different plottings, and will offer offers skeletons of python programs.


...

Section


Column
width350px

Column
width70%
Code Block
languagepy
titleSimple symbol plotting
collapsetrue
# importing Magics module
from Magics.macro import *

# Setting of the output file name
output = output(output_formats=['png'],
                output_name_first_page_number='off',
                output_name="odb_step1")

# Background Coastlines
background = mcoast(
    map_coastline_sea_shade_colour='white',
    map_coastline_land_shade_colour='cream',
    map_grid='on',
    map_coastline_land_shade='on',
    map_coastline_sea_shade='on',
    map_label='on',
    map_coastline_colour='tan',
    )
# Import odb data
odb = odb_geopoints(odb_filename='geo.odb',
                    odb_latitude_variable='lat@hdr',
                    odb_longitude_variable='lon@hdr',
                    )
# Define the symbol plotting
symbol = msymb(symbol_type='marker',
               symbol_colour='navy',
               symbol_marker_index=3,
               symbol_height=0.4,
            )
# Add a title 
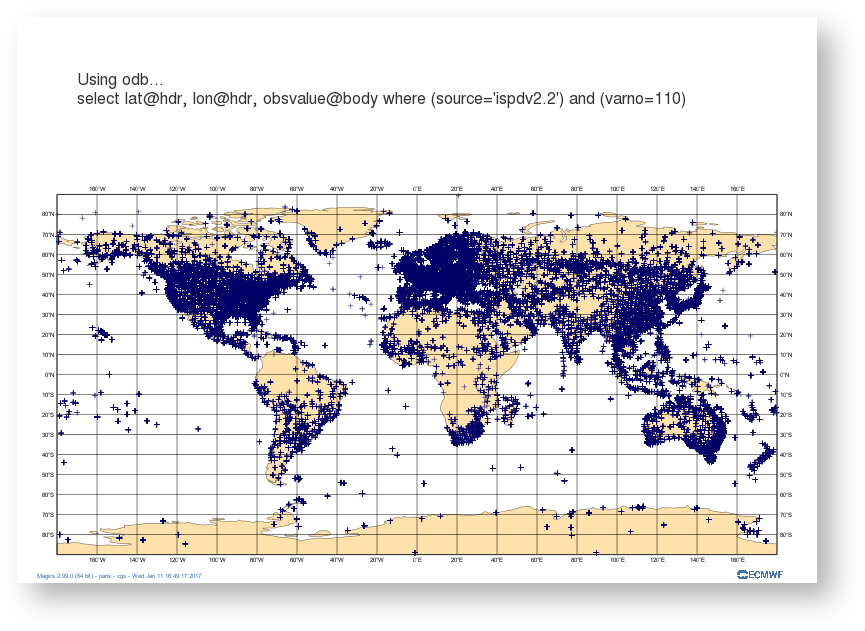
lines = ['Using odb...', 
         'select lat@hdr, lon@hdr, obsvalue@body where (source='ispdv2.2') and (varno=110)',
         ]

title = mtext(
    text_lines=lines,
    text_justification='left',
    text_font_size=0.7,
    text_colour='charcoal',
)

#Create the plot
plot(output, background, odb, symbol, title)

Download :


Now, we are going to colour the symbol according to the value of the observation. The advanced mode for symbol plotting offers an easy way to specify range and colours, we add a legend for readability.

...