...
| Section | ||||||||||||
|---|---|---|---|---|---|---|---|---|---|---|---|---|
Input data fields The following is for information only - FLEXPART Prepare handles these details internally. FLEXPART requires input fields on a regular latitude-longitude grid in GRIB format. The input data must contain five three-dimensional fields: the two horizontal wind components, vertical velocity, temperature and specific humidity. Additional surface fields (e.g. fluxes) are also needed. The three-dimensional input data has to be available on ECMWF model (i.e. η) levels defined by a hybrid vertical coordinate system. An important restriction is that all the data fields used within a FLEXPART run must have the same domain size, resolution, number of levels, etc. All the required fields, with one exception, can be retrieved from ECMWF's MARS archive. The only exception is vertical velocity because FLEXPART needs the following field for its computations:
Since only
is archived in MARS the full product needs to be computed during the data preparation process (FLEXPART Prepare does it for you). Input filenames FLEXPART requires all the input GRIB files to be in the same folder using the following file naming convention: ENyymmddhh. The same directory has to contain the AVAILABLE file as well (it is automatically generated by FLEXPART Prepare). |

The Eccharts Editor
| Info |
|---|
All the date parameters used for FLEXPART Prepare is given in YYYYMMDD format. Relative dates are allowed: e.g. -1 means yesterday, 0 means today, etc. |
Layer
|
The Eccharts Editor
Layer
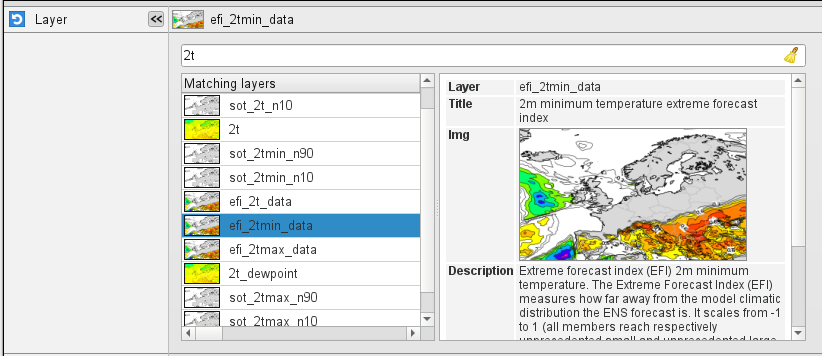
Specifies the name of the ecCharts Specifies the name of the Eccharts layer.
Style
Specifies the contouring style for the selected layer. Each Eccharts ecCharts layer is associated with a group of predefined styles. When a given layer is selected in Layer the icon editor only shows the available styles for that layer
...
and the default style is automatically selected.
Title
Specifies the
...
["sd","msl","tcc","10u","10v","2t","2d","sp", "z","lsm","lcc","mcc","hcc","skt", "stl1","swvl1"]
...
type of the title generated for the plot. The possible values are as follows:
- default: the standard Metview automatic title will be used and the resulting list will not contain a Text plotting icon. This is how it looks:
![]()
- style_1: the resulting list will contain a Text plotting icon defining a title of a different style. This is how it looks:
![]()
The default option is default.
| Note |
|---|
When overlaying an EcCharts icon with other EcCharts icons or fields always use the default option (otherwise the contouring setting could be applied incorrectly to some of the fields). |
This option was introduced in Metview 5.8.0
...
.
Date
Specifies the run date of the forecast. Available when Prepare Mode is forecast.
Time
Specifies the run time of the forecast in hours. Available when Prepare Mode is forecast.
Step
Specifies the forecast steps in hours. Here a list of values is given. Available when Prepare Mode is forecast.
Period Start Date
Specifies the start date of the period. Available when Prepare Mode is period.
Period Start Time
Specifies the start time of the period. Available when Prepare Mode is period.
Period End Date
Specifies the end date of the period. Available when Prepare Mode is period.
Period End Time
Specifies the end time of the period. Available when Prepare Mode is period.
Period Step
Specifies the time step of the period in hours. The allowed values are as follows: 3 or 6. Available when Prepare Mode is period. The default value is 3.
Grid Interpolation
Specifies if the input GRIB fields need to be interpolated onto a target grid specified by Area and Grid. The possible values are on/off. Available when Input source is file. The default value is: on.
Area
Specifies the area of the output grid in south/west/north/east format. The default value is -90/-179/90/180.
...
This is the same Date parameter as in the MARS retrieval icon. The date is given in YYYYMMDD format. Relative dates are allowed: e.g. -1 means yesterday, 0 means today, etc. The default is -1.
Time
Specifies the run time of the forecast. This is the same Time parameter as in the MARS retrieval icon. The default is 0.
Step
Specifies the forecast steps in hours. Here a list of values can be given.
Grid
Specifies the resolution of the output resulting global grid in dx/dy format, where dx is the grid increment in eastWest-west East direction, while dy is the grid increment in northSouth-south North direction (both in units of degrees). The default value is: 1/1.
Top Level
Only data on and below this model level will be used to generate the FLEXPART input fields. This level can be specified either as a model level or as a pressure value. In the latter case FLEXPART Prepare will use the data retrieved for the first date to determine the topmost model level. The default value of this parameter is 1, which means that all the model levels will be used if Top Level Units is set to model_levels.
Top Level Units
Specifies the units of the value of Top Level. The allowed values are model_levels or hPa. The default value is model_levels.
Reuse Input
If this parameter is set on FLEXPART Prepare checks the existence of the data files to be generated and if they are already in place no new data is retrieved and processed. If it is off all the fields are always retrieved and processed and the existing data files are overwritten. The same happens to the AVAILABLE file. The existence of a FLEXPART input GRIB file is checked by using the file name and a set of ecCodes keys from the first message in the file. These keys are as follows: date, time, stepRange, gridType, iDirectionIncrement, jDirectionIncrement, latitudeOfFirstGridPoint, latitudeOfLastGridPoint, longitudeOfFirstGridPoint, longitudeOfLastGridPoint.
Output Path
...
Fail On Data Error
When this parameter is set to yes an error in the data retrieval or the post-processing steps will force the icon to fail and a Macro/Python script running the eccharts()function will fail as well. While if it is set to no the icon will not fail and the eccharts command in Macro/Python will return nil/None. The default value is yes
...
.