Status:Ongoing analysis Material Status: Finalised Material from: Linus
| Show If | ||
|---|---|---|
| ||
Discussed in the following Daily reports: |
...
2. Description of the event
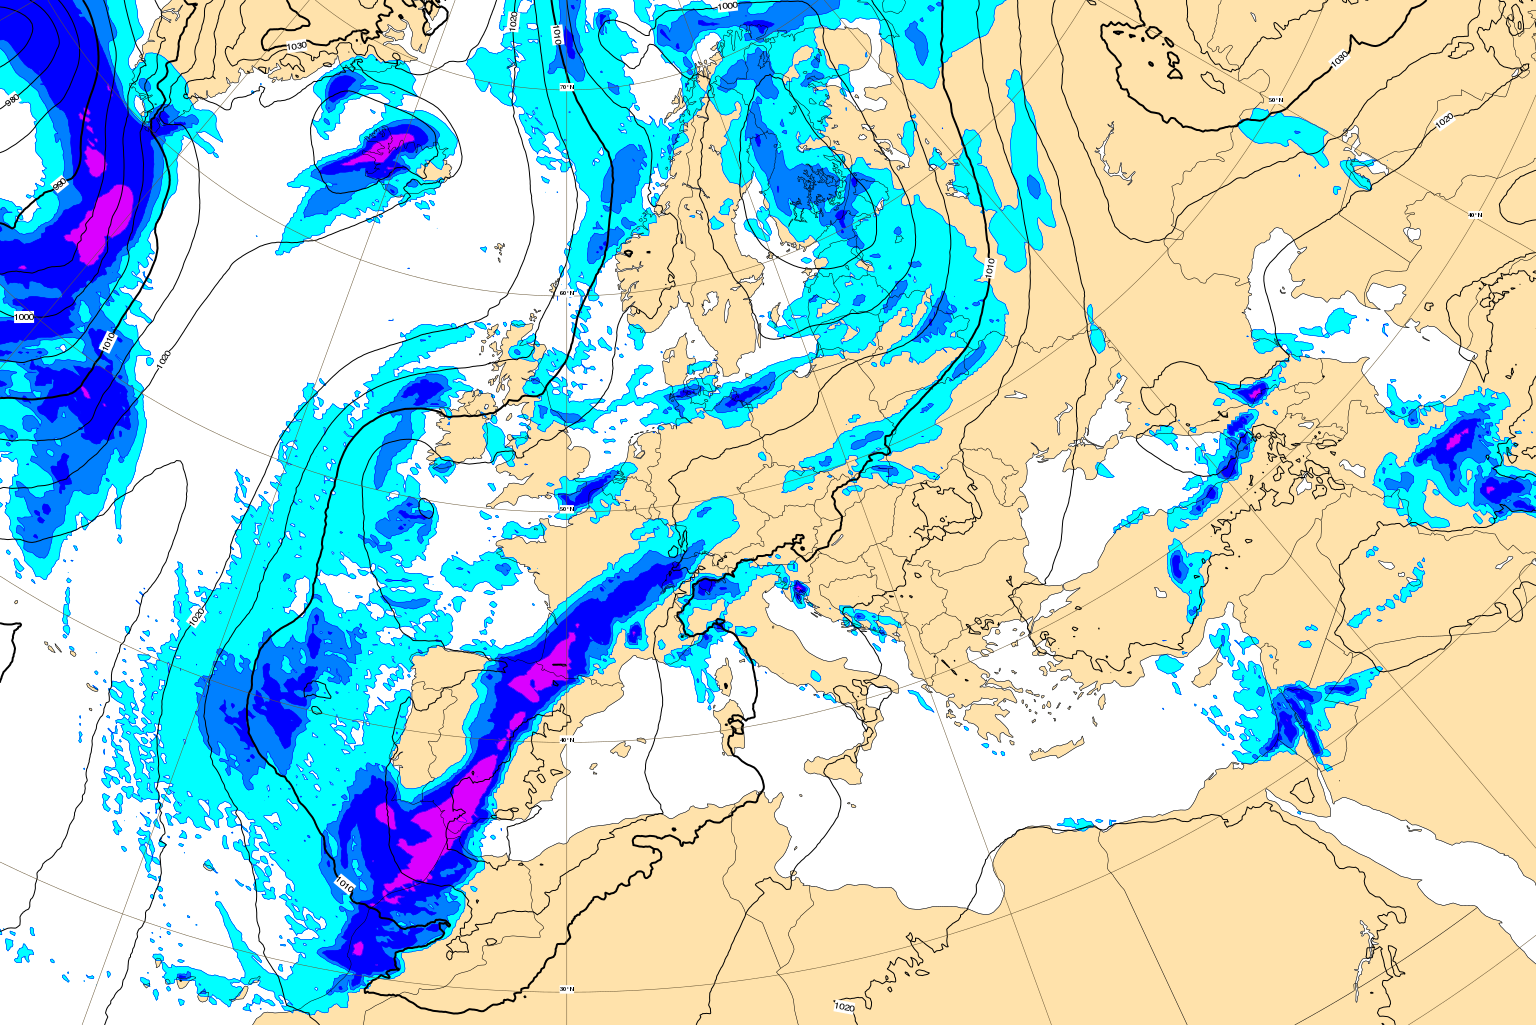
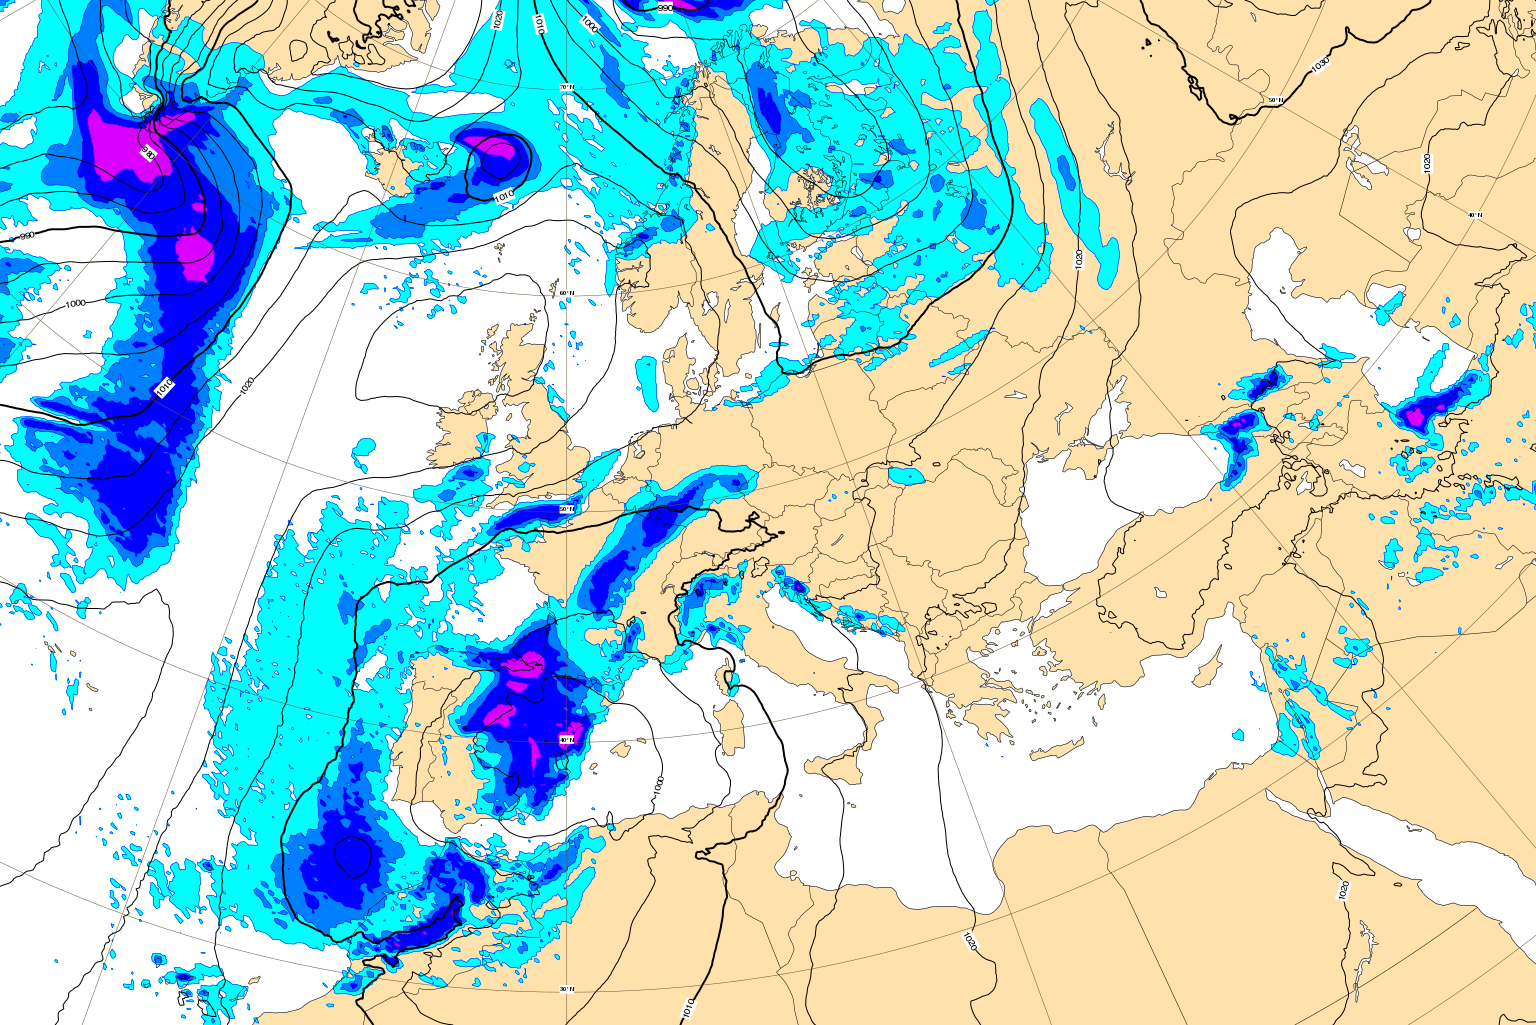
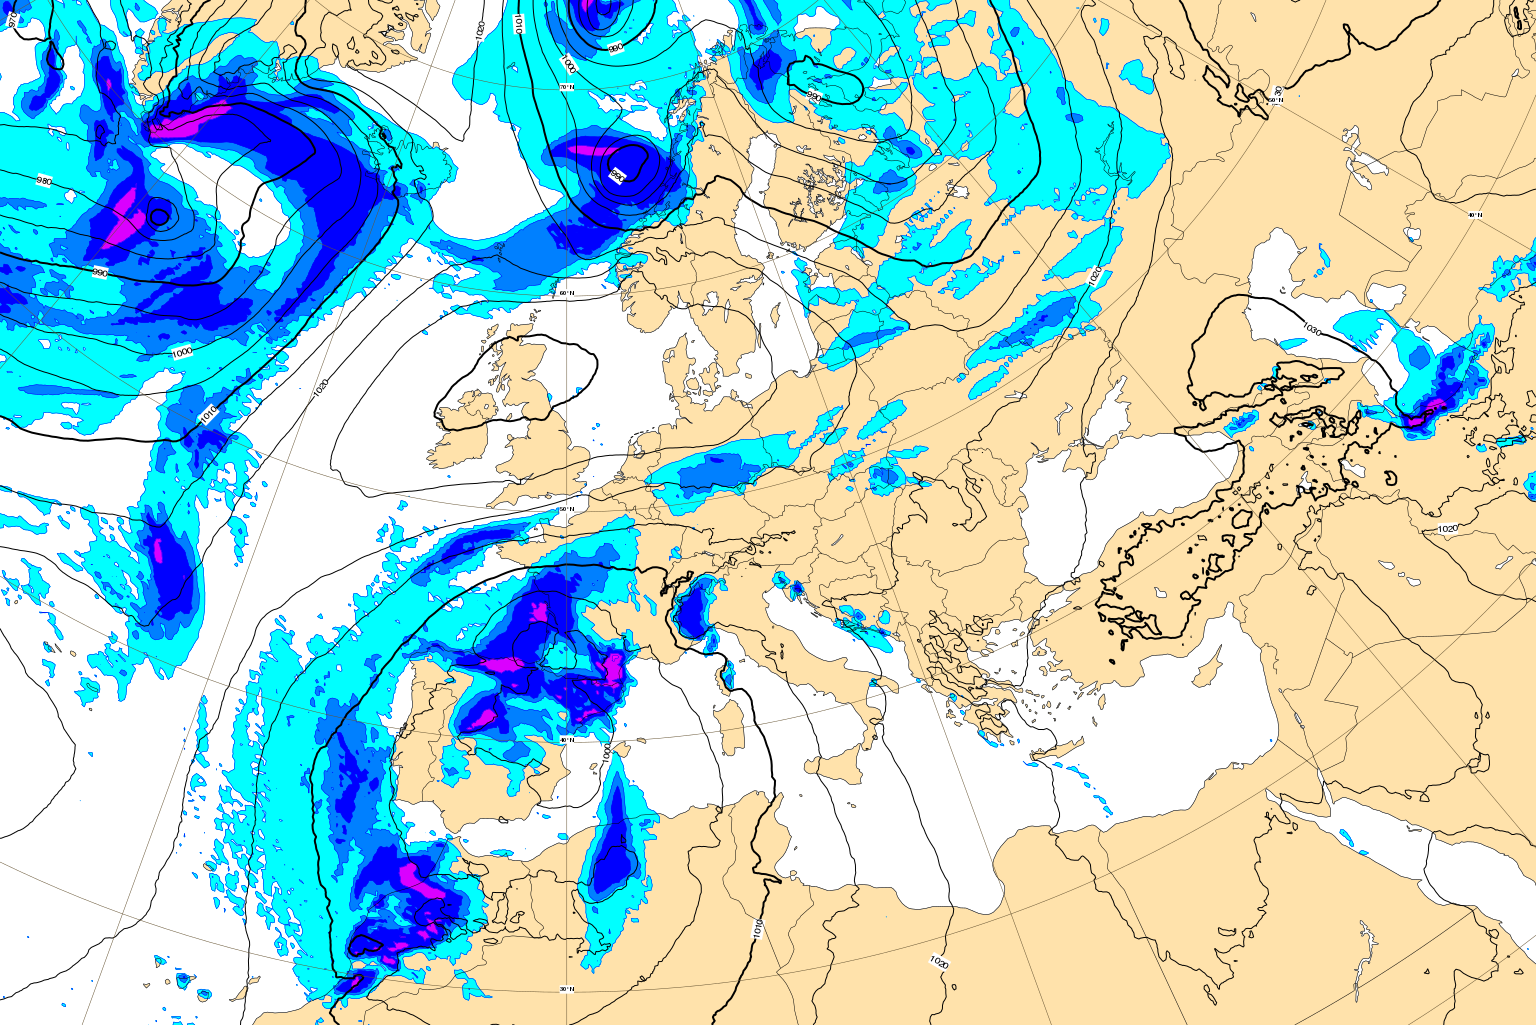
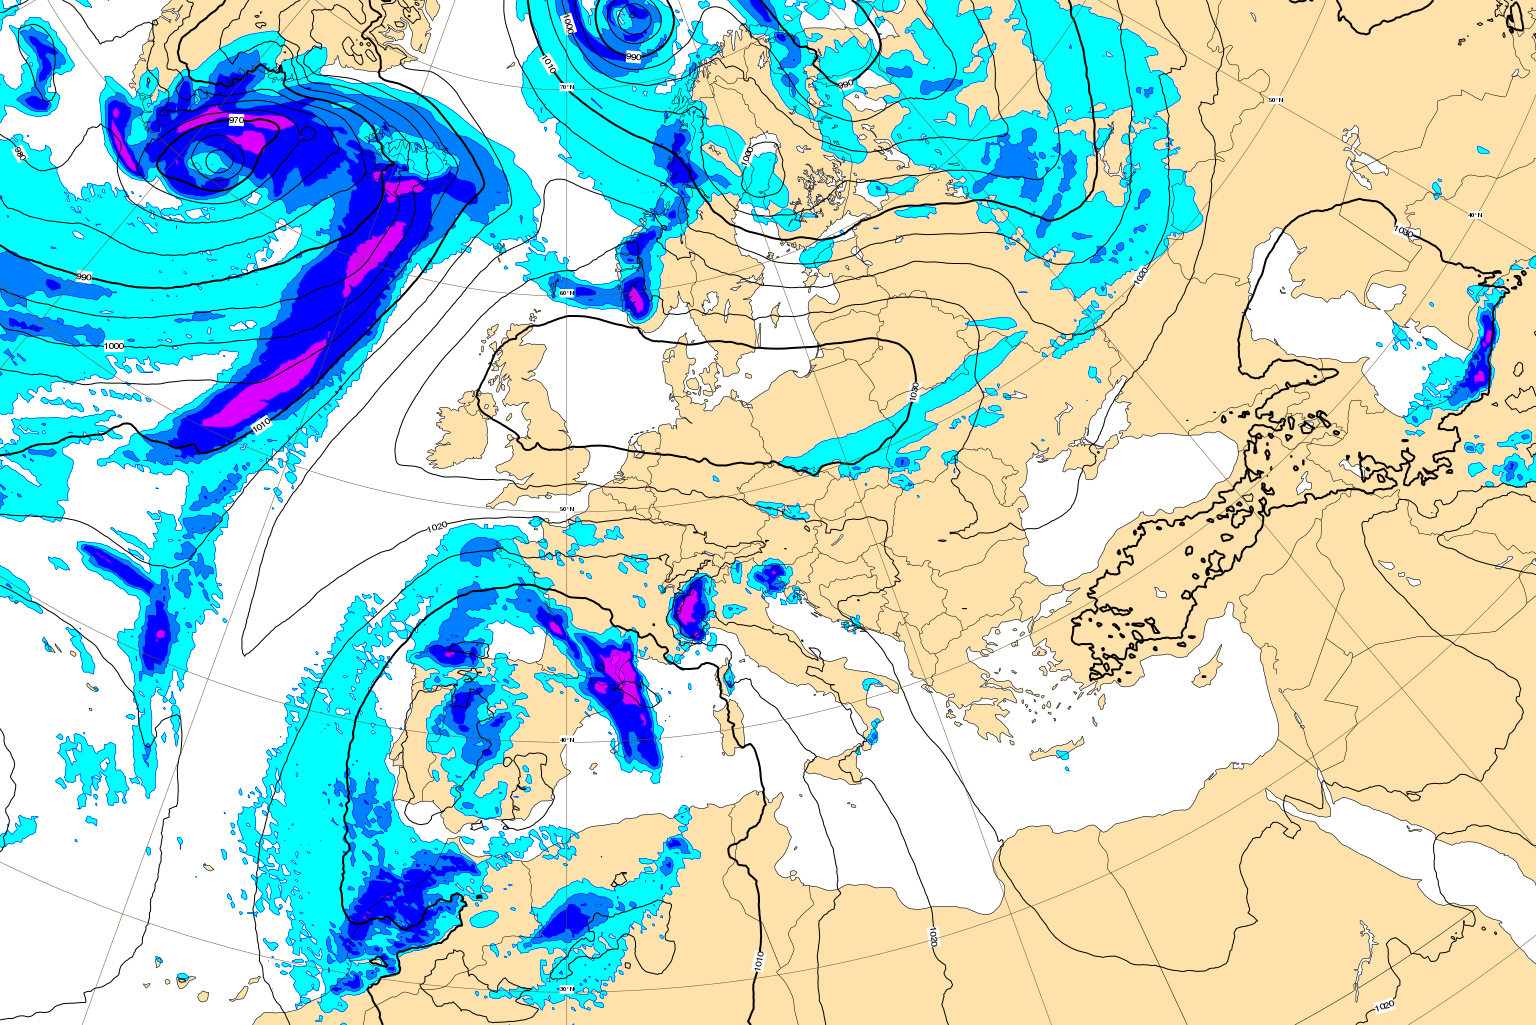
The plots below show MSLP and 6-hour precipitation with plots every 12th hour starting from 6 January 06z and ending 7 January 18z.
3. Predictability
3.1 Data assimilation
3.2 HRES
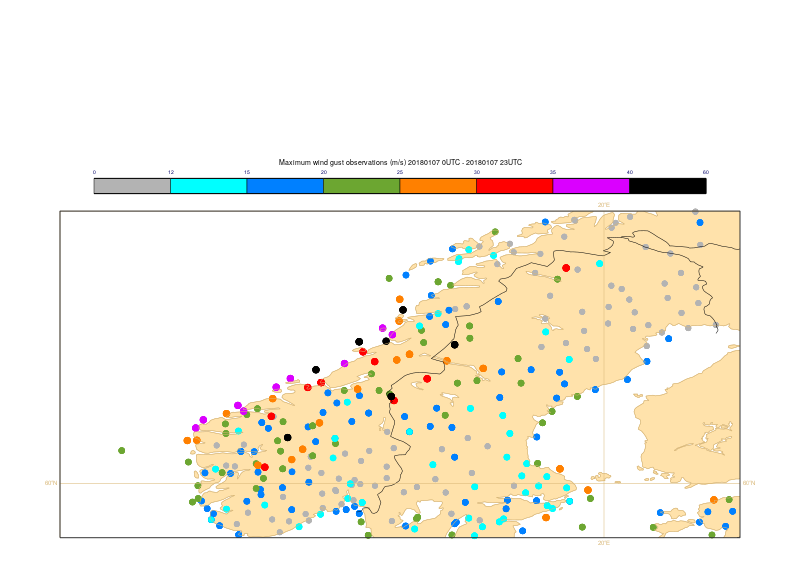
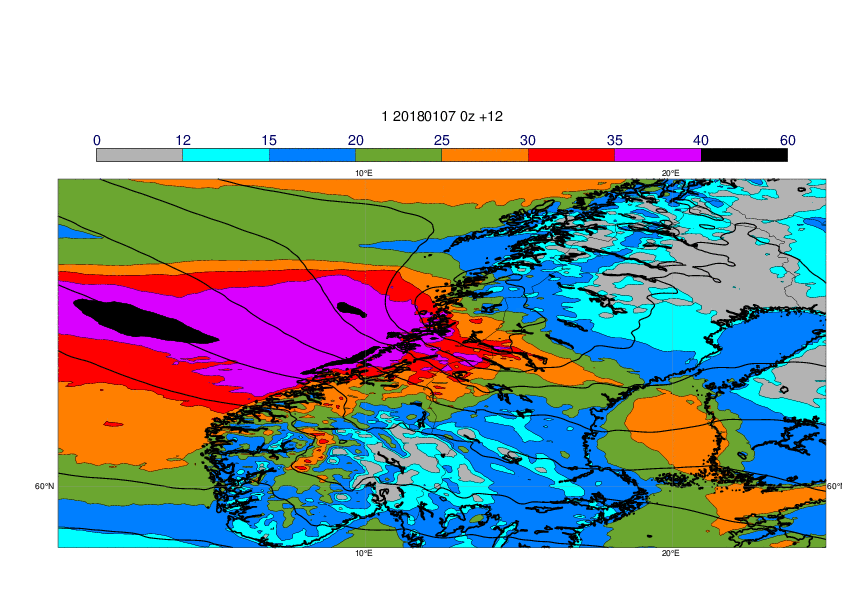
Observations of 24-hour maximum wind gusts on 7 January (left) and forecast for the maximum wind gusts (shade) and MSLP valid 12z (right).
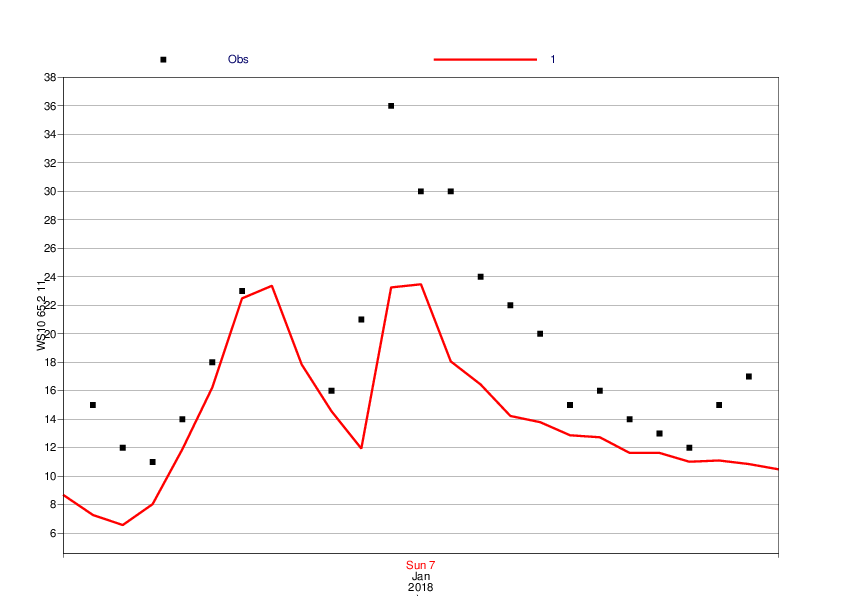
The plot below shows time-series of 10-metre mean wind for Heimoya (65.2N/11E) from HRES (red) and observations (black).
3.3 ENS
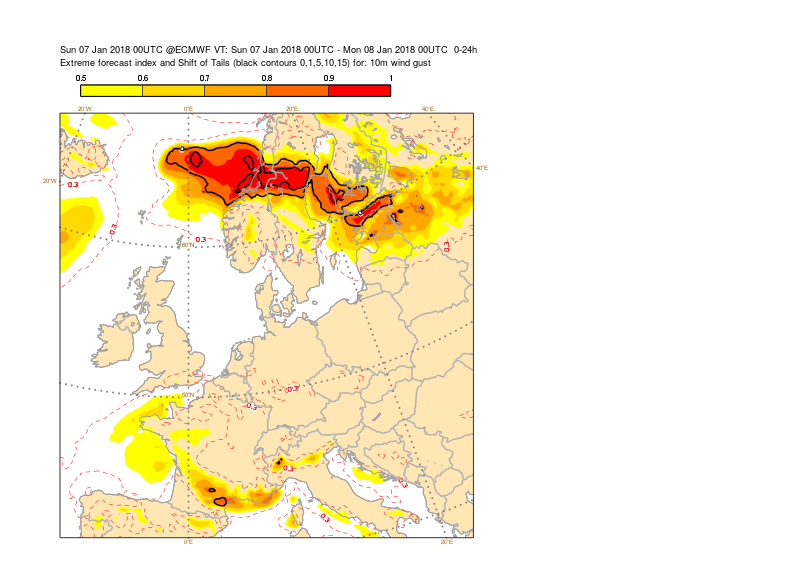
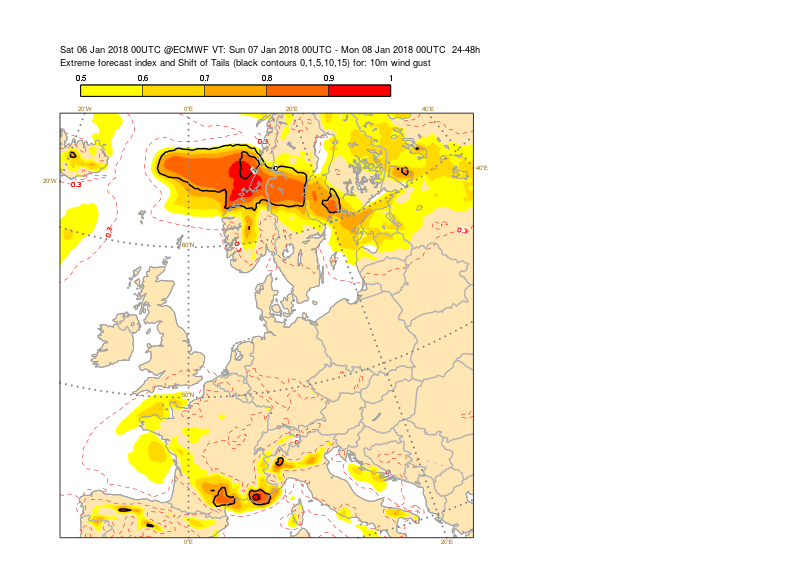
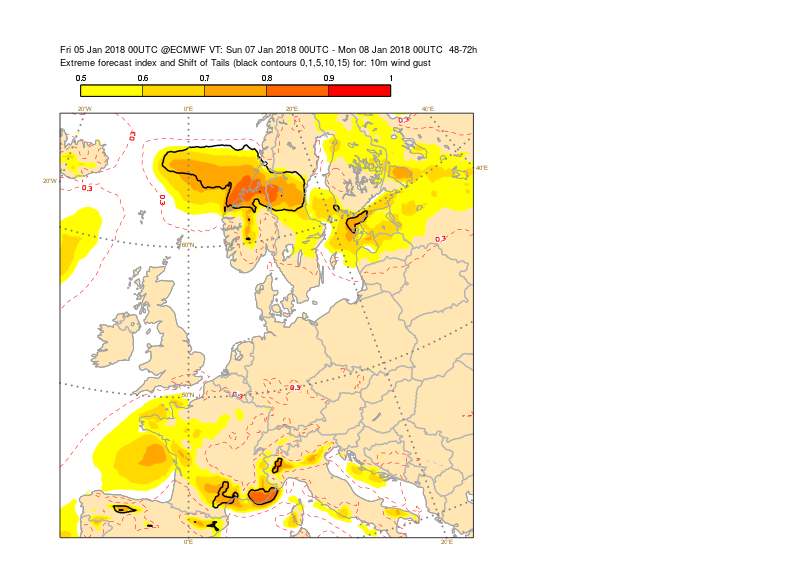
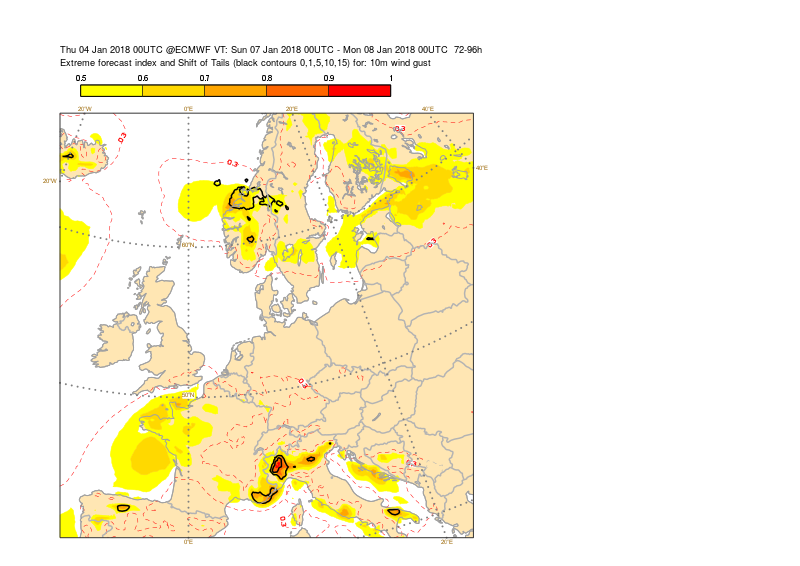
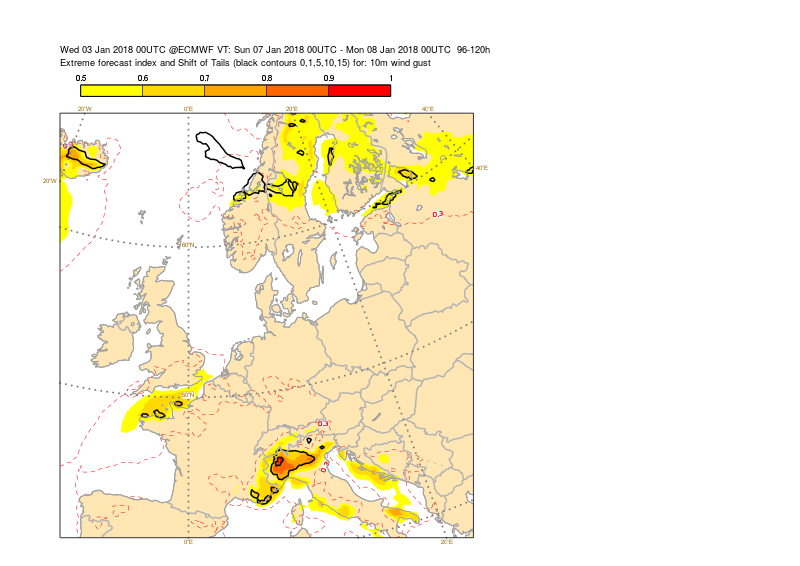
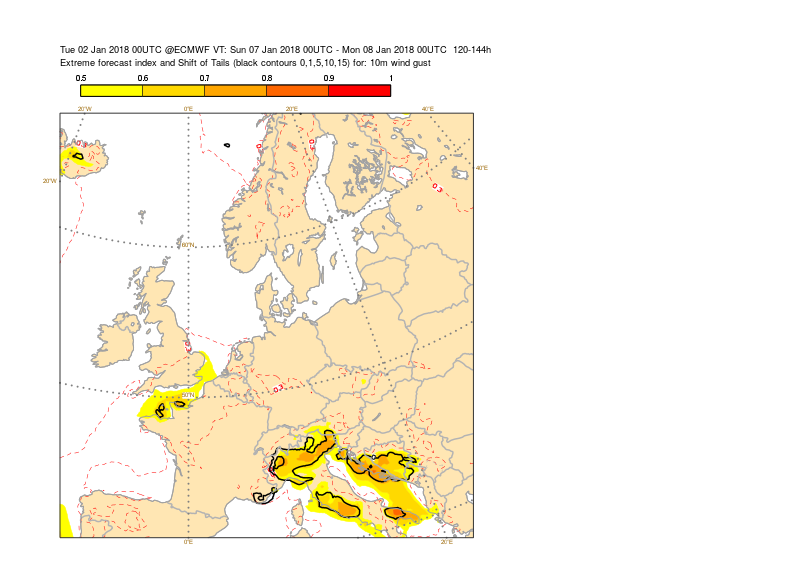
The plots below show EFI and SOT for 24-hour maximum wind gusts on 7 January from different initial times.
3.4 Monthly forecasts
3.5 Comparison with other centres
...
4. Experience from general performance/other cases
...
5. Good and bad aspects of the forecasts for the event
...