Versions Compared

Key

  • This line was added.
  • This line was removed.
  • Formatting was changed.


Section


Column
width250px40%


Column
width60%


Panel

Objectives


  • Set-up a cartesian projection for the Cross section
  • Configure the axis
  • Load a Netcdf netCDF file, and understand the information needed by Magics.
  • Apply a shading
  • Position the legend box
  • Add a text.

You will need to download


...

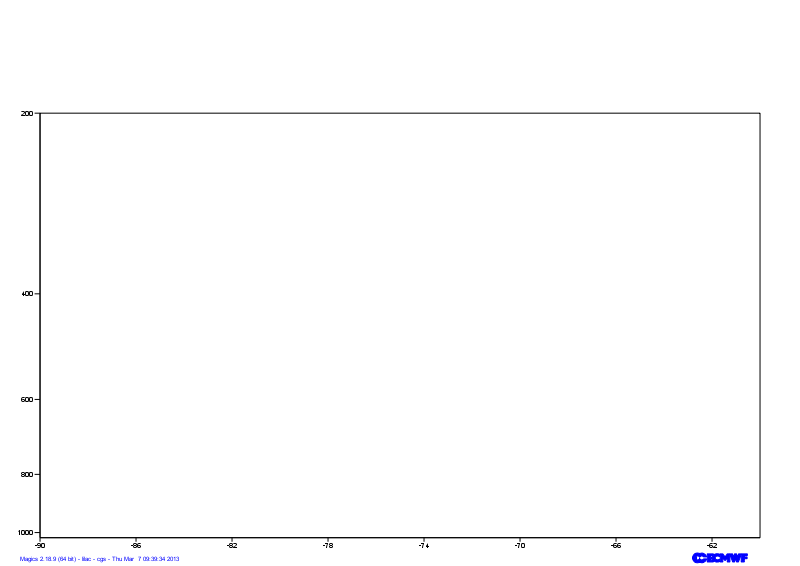
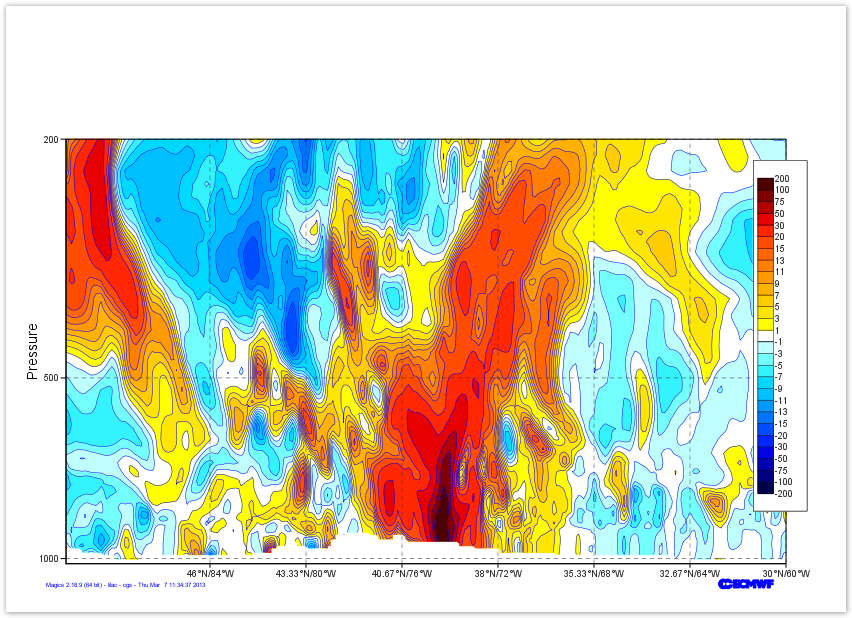
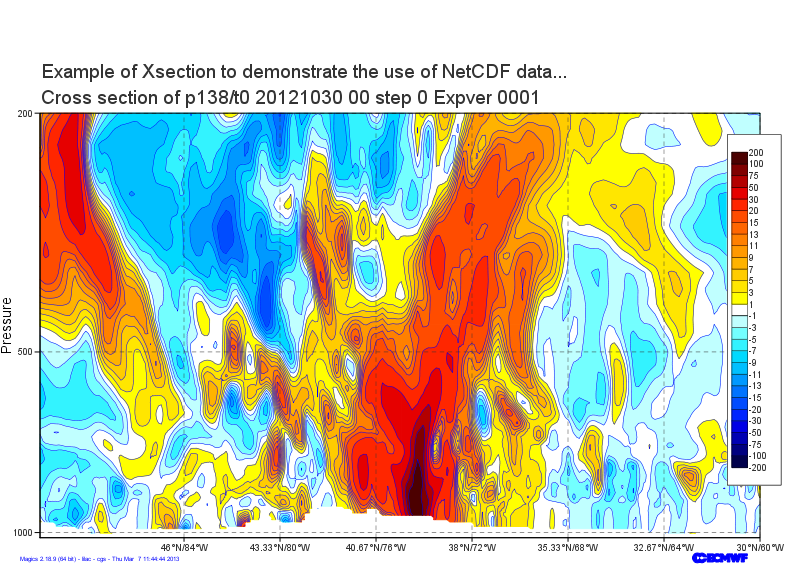
  • The vertical coordinate system is a logarithmic axis from 1000 hPa to 200 hPa.
  • The horizontal coordinate system is a geoline axis from [50oN, 90oEW] to  [30oN, 60oEW]

Have a look at the  subpage documentation to learn how to setup a cartesian projection .

...

Section


Column
width50%


Info
titleParameters to check

Useful subpage parameters

subpage_map_projection

subpage_x_axis_type
subpage_y_axis_type
subpage_x_min_latitude
subpage_x_min_longitude
subpage_x_max_latitude
subpage_x_max_longitude
subpage_y_min
subpage_y_max


Code Block
language
languagepython
themeConfluencepython
titlePython - Setting a projection
collapsetrue
from Magics.macro import *
#setting the output 
output = output(    
                output_formats = ['png'],
                output_name = "xsect_step1",
                output_name_first_page_number = "off"
        )
# Setting the cartesian view
projection = mmap(
        subpage_map_projection='cartesian',
        subpage_x_axis_type='geoline',
        subpage_y_axis_type='logarithmic',
        subpage_x_min_latitude=50.,
        subpage_x_max_latitude=30.,
        subpage_x_min_longitude=-90.,
        subpage_x_max_longitude=-60.,
        subpage_y_min=1020.,
        subpage_y_max=200.,
        )
# Vertical axis
vertical = maxis(
        axis_orientation='vertical',
        )
# Horizontal axis
horizontal = maxis(
        axis_orientation='horizontal',
        )
        
plot(output, projection, horizontal, vertical)


Column
width200px


...

Section


Column
width50%


Info
titleParameters to check

Useful axis parameters

axis_type

axis_tick_label_height
axis_tick_label_colour
axis_grid
axis_title


Code Block
language
languagepython
themeConfluencepython
titlePython - adjusting the axis
collapsetrue
from Magics.macro import *
#setting the output 
output = output(    
                output_formats = ['png'],
                output_name = "xsect_step2",
                output_name_first_page_number = "off"
        )
# Setting the cartesian view
projection = mmap(
        subpage_map_projection='cartesian',
        subpage_x_axis_type='geoline',
        subpage_y_axis_type='logarithmic',
        subpage_x_min_latitude=50.,
        subpage_x_max_latitude=30.,
        subpage_x_min_longitude=-90.,
        subpage_x_max_longitude=-60.,
        subpage_y_min=1020.,
        subpage_y_max=200.,
        )
# Vertical axis
vertical = maxis(
        axis_orientation='vertical',
        axis_grid='on',
        axis_type='logarithmic',
        axis_tick_label_height=0.4,
        axis_tick_label_colour='charcoal',
        axis_grid_colour='charcoal',
        axis_grid_line_style='dash',
        axis_title='on',
        axis_title_text='Pressure',
        axis_title_height=0.6,
        )
# Horizontal axis
horizontal = maxis(
        axis_orientation='horizontal',
        axis_type='geoline',
        axis_tick_label_height=0.4,
        axis_tick_label_colour='charcoal',
        axis_grid='on',
        axis_grid_colour='charcoal',
        axis_grid_thickness=1,
        axis_grid_line_style='dash',
        )
plot(output, projection, horizontal, vertical)


Column
width200px


Loading the

...

netCDF data

In this exercise, we want to visualise a matrix stored in a Netcdf netCDF file. Netcdf netCDF is a very generic format, and can contain a lot of data.   The user needs We will  need to set up some information in order to explain to Magics which variable to plot, and how to interpret it.

To do that, the mnetcdf defines The mnetcdf data action comes with a parameter list that can be found in the  Netcdf netCDF Input Page.

NowBut first, tetlet's see what is inside our Netcdf netCDF Data

Code Block
titlencdump section.nc
netcdfnetCDF section {
dimensions:
        levels = 85 ;
        longitude = 144 ;
        latitude = 144 ;
        p15220121030000000000001_1 = 2 ;
        p15220121030000000000001_2 = 144 ;
        orography_x_values = 144 ;
        orography_y1_values = 144 ;
        orography_y2_values = 144 ;
variables:
        double levels(levels) ;
        double longitude(longitude) ;
        double latitude(latitude) ;
        double p13820121030000000000001(levels, longitude) ;

We want to display the variable p1382012103000000000000p13820121030000000000001, and inform Magics that the dimensions of th ematrix the matrix are described in the 2 variables levels and longitude.

...

Section


Column
width50%


Info
titleParameters to check

Useful Netcdf netCDF parameters

netcdf_filename

netcdf_value_variable
netcdf_field_scaling_factor
netcdf_y_variable
netcdf_x_variable
netcdf_x_auxiliary_variable


Code Block
languagepython
themeConfluencelanguagepython
titlePython - Loading a Netcdf
collapsetrue
from Magics.macro import *
#setting the output 
output = output(    
                output_formats = ['png'],
                output_name = "xsect_step3",
                output_name_first_page_number = "off"
        )
# Setting the cartesian view
projection = mmap(
        subpage_map_projection='cartesian',
        subpage_x_axis_type='geoline',
        subpage_y_axis_type='logarithmic',
        subpage_x_min_latitude=50.,
        subpage_x_max_latitude=30.,
        subpage_x_min_longitude=-90.,
        subpage_x_max_longitude=-60.,
        subpage_y_min=1020.,
        subpage_y_max=200.,
        )
# Vertical axis
vertical = maxis(
        axis_orientation='vertical',
        axis_grid='on',
        axis_type='logarithmic',
        axis_tick_label_height=0.4,
        axis_tick_label_colour='charcoal',
        axis_grid_colour='charcoal',
        axis_grid_thickness=1,
        axis_grid_reference_line_style='solid',
        axis_grid_reference_thickness=1,
        axis_grid_line_style='dash',
        axis_title='on',
        axis_title_text='Pressure',
        axis_title_height=0.6,
        )
# Horizontal axis
horizontal = maxis(
        axis_orientation='horizontal',
        axis_type='geoline',
        axis_tick_label_height=0.4,
        axis_tick_label_colour='charcoal',
        axis_grid='on',
        axis_grid_colour='charcoal',
        axis_grid_thickness=1,
        axis_grid_line_style='dash',
        )
# Definition of the NetcdfnetCDF data and interpretation
data = mnetcdf(netcdf_filename = "section.nc",
      netcdf_value_variable = "p13820121030000000000001",
      netcdf_field_scaling_factor = 100000.,
      netcdf_y_variable = "levels",
      netcdf_x_variable = "longitude",
      netcdf_x_auxiliary_variable = "latitude"
    )
contour = mcont()
plot(output, projection, horizontal, vertical, data, contour)


Column
width200px


...

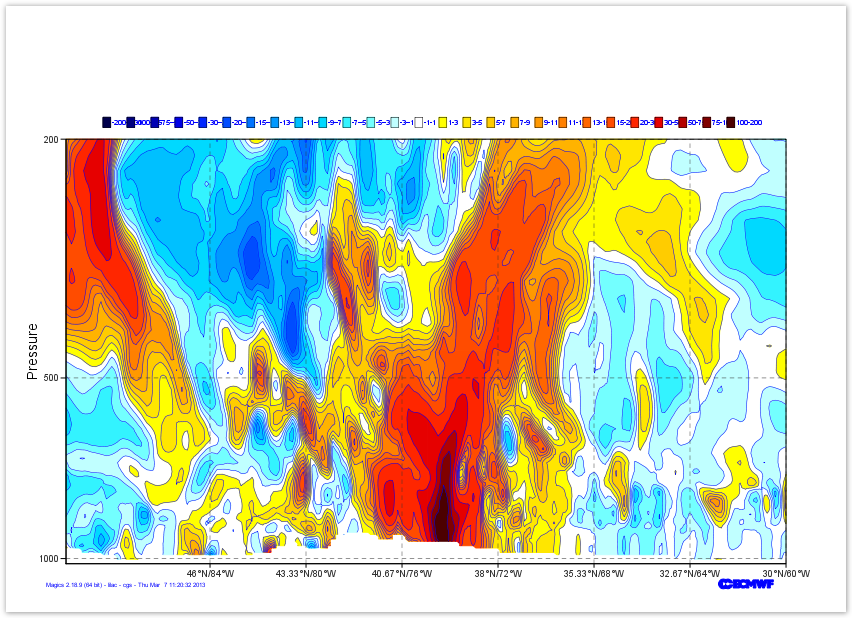
and the list of colours is : ["rgb(0,0,0.3)", "rgb(0,0,0.5)", "rgb(0,0,0.7)", "rgb(0,0,0.9)", "rgb(0,0.15,1)", "rgb(0,0.3,1)", "rgb(0,0.45,1)", "rgb(0,0.6,1)", "rgb(0,0.75,1)", "rgb(0,0.85,1)", "rgb(0.2,0.95,1)", "rgb(0.45,1,1)", "rgb(0.75,1,1)", "none", "rgb(1,1,0)","rgb(1,0.9,0)", "rgb(1,0.8,0)", "rgb(1,0.7,0)", "rgb(1,0.6,0)", "rgb(1,0.5,0)", "rgb(1,0.4,0)", "rgb(1,0.3,0)", "rgb(1,0.15,0)", "rgb(0.9,0,0)", "rgb(0.7,0,0)", "rgb(0.5,0,0)", "rgb(0.3,0,0)"],

Do not forget to trun turn the legend on ...

You could quickly check Contour Documentation

Section


Column
width50%


Info
titleParameters to check

Useful contour parameters

contour_level_selection_type

contour_level_list
contour_shade

contour_shade_method

contour_shade_colour_method

contour_shade_colour_list
legend


Code Block
languagepython
themeConfluence
languagepython
titlePython - Using a shading
collapsetrue
from Magics.macro import *
#setting the output 
output = output(    
                output_formats = ['png'],
                output_name = "xsect_step3",
                output_name_first_page_number = "off"
        )
# Setting the cartesian view
projection = mmap(
        subpage_map_projection='cartesian',
        subpage_x_axis_type='geoline',
        subpage_y_axis_type='logarithmic',
        subpage_x_min_latitude=50.,
        subpage_x_max_latitude=30.,
        subpage_x_min_longitude=-90.,
        subpage_x_max_longitude=-60.,
        subpage_y_min=1020.,
        subpage_y_max=200.,
        )
# Vertical axis
vertical = maxis(
        axis_orientation='vertical',
        axis_grid='on',
        axis_type='logarithmic',
        axis_tick_label_height=0.4,
        axis_tick_label_colour='charcoal',
        axis_grid_colour='charcoal',
        axis_grid_thickness=1,
        axis_grid_reference_line_style='solid',
        axis_grid_reference_thickness=1,
        axis_grid_line_style='dash',
        axis_title='on',
        axis_title_text='Pressure',
        axis_title_height=0.6,
        )
# Horizontal axis
horizontal = maxis(
        axis_orientation='horizontal',
        axis_type='geoline',
        axis_tick_label_height=0.4,
        axis_tick_label_colour='charcoal',
        axis_grid='on',
        axis_grid_colour='charcoal',
        axis_grid_thickness=1,
        axis_grid_line_style='dash',
        )
# Definition of the NetcdfnetCDF data and interpretation
data = mnetcdf(netcdf_filename = "section.nc",
      netcdf_value_variable = "p13820121030000000000001",
      netcdf_field_scaling_factor = 100000.,
      netcdf_y_variable = "levels",
      netcdf_x_variable = "longitude",
      netcdf_x_auxiliary_variable = "latitude"
    )
contour = mcont(contour_highlight= "off",
    contour_hilo= "off",
    contour_label= "off",
    legend='on',
    contour_level_list= [-200., -100., -75., -50., -30., -20., 
        -15., -13., -11., -9., -7., -5., -3., -1., 1., 3., 5., 
        7., 9., 11., 13., 15., 20., 30., 50., 75., 100., 200],
    contour_level_selection_type= "level_list",
    contour_shade= "on",
    contour_shade_colour_list= ["rgb(0,0,0.3)", "rgb(0,0,0.5)", 
        "rgb(0,0,0.7)", "rgb(0,0,0.9)", "rgb(0,0.15,1)", 
        "rgb(0,0.3,1)", "rgb(0,0.45,1)", "rgb(0,0.6,1)", 
        "rgb(0,0.75,1)", "rgb(0,0.85,1)", "rgb(0.2,0.95,1)", 
        "rgb(0.45,1,1)", "rgb(0.75,1,1)", "none", "rgb(1,1,0)", 
        "rgb(1,0.9,0)", "rgb(1,0.8,0)", "rgb(1,0.7,0)", 
        "rgb(1,0.6,0)", "rgb(1,0.5,0)", "rgb(1,0.4,0)", 
        "rgb(1,0.3,0)", "rgb(1,0.15,0)", "rgb(0.9,0,0)", 
        "rgb(0.7,0,0)", "rgb(0.5,0,0)", "rgb(0.3,0,0)"],
    contour_shade_colour_method= "list",
    contour_shade_method= "area_fill")
plot(output, projection, horizontal, vertical, data, contour)


Column
width200px


...

Section


Column
width50%


Info
titleParameters to check

Useful legend parameters

legend

legend_display_type

legend_box_mode

legend_box_x_position

legend_box_y_position

legend_box_x_length

legend_box_y_length
legend_box_blanking
legend_border


Code Block
languagepython
themeConfluencelanguagepython
titlePython - Position the legend
collapsetrue
from Magics.macro import *
#setting the output 
output = output(    
                output_formats = ['png'],
                output_name = "xsect_step5",
                output_name_first_page_number = "off"
        )
# Setting the cartesian view
projection = mmap(
        subpage_map_projection='cartesian',
        subpage_x_axis_type='geoline',
        subpage_y_axis_type='logarithmic',
        subpage_x_min_latitude=50.,
        subpage_x_max_latitude=30.,
        subpage_x_min_longitude=-90.,
        subpage_x_max_longitude=-60.,
        subpage_y_min=1020.,
        subpage_y_max=200.,
        )
# Vertical axis
vertical = maxis(
        axis_orientation='vertical',
        axis_grid='on',
        axis_type='logarithmic',
        axis_tick_label_height=0.4,
        axis_tick_label_colour='charcoal',
        axis_grid_colour='charcoal',
        axis_grid_thickness=1,
        axis_grid_reference_line_style='solid',
        axis_grid_reference_thickness=1,
        axis_grid_line_style='dash',
        axis_title='on',
        axis_title_text='Pressure',
        axis_title_height=0.6,
        )
# Horizontal axis
horizontal = maxis(
        axis_orientation='horizontal',
        axis_type='geoline',
        axis_tick_label_height=0.4,
        axis_tick_label_colour='charcoal',
        axis_grid='on',
        axis_grid_colour='charcoal',
        axis_grid_thickness=1,
        axis_grid_line_style='dash',
        )
# Definition of the NetcdfnetCDF data and interpretation
data = mnetcdf(netcdf_filename = "section.nc",
      netcdf_value_variable = "p13820121030000000000001",
      netcdf_field_scaling_factor = 100000.,
      netcdf_y_variable = "levels",
      netcdf_x_variable = "longitude",
      netcdf_x_auxiliary_variable = "latitude"
    )
contour = mcont(contour_highlight= "off",
    contour_hilo= "off",
    contour_label= "off",
    legend='on',
    contour_level_list= [-200., -100., -75., -50., -30., -20., 
        -15., -13., -11., -9., -7., -5., -3., -1., 1., 3., 5., 
        7., 9., 11., 13., 15., 20., 30., 50., 75., 100., 200],
    contour_level_selection_type= "level_list",
    contour_shade= "on",
    contour_shade_colour_list= ["rgb(0,0,0.3)", "rgb(0,0,0.5)", 
        "rgb(0,0,0.7)", "rgb(0,0,0.9)", "rgb(0,0.15,1)", 
        "rgb(0,0.3,1)", "rgb(0,0.45,1)", "rgb(0,0.6,1)", 
        "rgb(0,0.75,1)", "rgb(0,0.85,1)", "rgb(0.2,0.95,1)", 
        "rgb(0.45,1,1)", "rgb(0.75,1,1)", "none", "rgb(1,1,0)", 
        "rgb(1,0.9,0)", "rgb(1,0.8,0)", "rgb(1,0.7,0)", 
        "rgb(1,0.6,0)", "rgb(1,0.5,0)", "rgb(1,0.4,0)", 
        "rgb(1,0.3,0)", "rgb(1,0.15,0)", "rgb(0.9,0,0)", 
        "rgb(0.7,0,0)", "rgb(0.5,0,0)", "rgb(0.3,0,0)"],
    contour_shade_colour_method= "list",
    contour_shade_method= "area_fill")
legend = mlegend(legend='on', 
    legend_display_type='continuous', 
    legend_text_colour='charcoal',         
    legend_text_font_size=0.4, 
    legend_box_mode = "positional",
    legend_box_x_position = 27.00,
    legend_box_y_position = 3.00,
    legend_box_x_length = 2.00,
    legend_box_y_length = 13.00,
    legend_box_blanking = "on",
    legend_border = "on",
    legend_border_colour='charcoal')
 plot(output, projection, horizontal, vertical, data, contour, legend)


Column
width200px


...

Here we will use a combination of User text and automatic text ( read from the Netcdf netCDF global attribute title)

To get the automatic title, you have to use the following tag <magics_title/>

Check the Text Plotting Page for more information

Section


Column
width50%


Info
titleParameters to check

Useful Text parameters

text_lines

text_font_size
text_colour
text_font_style


Code Block
languagepython
themeConfluence
languagepython
titlePython - Position the legend
collapsetrue
from Magics.macro import *
#setting the output 
output = output(    
                output_formats = ['png'],
                output_name = "xsect_step6",
                output_name_first_page_number = "off"
        )
# Setting the cartesian view
projection = mmap(
        subpage_map_projection='cartesian',
        subpage_x_axis_type='geoline',
        subpage_y_axis_type='logarithmic',
        subpage_x_min_latitude=50.,
        subpage_x_max_latitude=30.,
        subpage_x_min_longitude=-90.,
        subpage_x_max_longitude=-60.,
        subpage_y_min=1020.,
        subpage_y_max=200.,
        )
# Vertical axis
vertical = maxis(
        axis_orientation='vertical',
        axis_grid='on',
        axis_type='logarithmic',
        axis_tick_label_height=0.4,
        axis_tick_label_colour='charcoal',
        axis_grid_colour='charcoal',
        axis_grid_thickness=1,
        axis_grid_reference_line_style='solid',
        axis_grid_reference_thickness=1,
        axis_grid_line_style='dash',
        axis_title='on',
        axis_title_text='Pressure',
        axis_title_height=0.6,
        )
# Horizontal axis
horizontal = maxis(
        axis_orientation='horizontal',
        axis_type='geoline',
        axis_tick_label_height=0.4,
        axis_tick_label_colour='charcoal',
        axis_grid='on',
        axis_grid_colour='charcoal',
        axis_grid_thickness=1,
        axis_grid_line_style='dash',
        )
# Definition of the NetcdfnetCDF data and interpretation
data = mnetcdf(netcdf_filename = "section.nc",
      netcdf_value_variable = "p13820121030000000000001",
      netcdf_field_scaling_factor = 100000.,
      netcdf_y_variable = "levels",
      netcdf_x_variable = "longitude",
      netcdf_x_auxiliary_variable = "latitude"
    )
contour = mcont(contour_highlight= "off",
    contour_hilo= "off",
    contour_label= "off",
    legend='on',
    contour_level_list= [-200., -100., -75., -50., -30., -20., 
        -15., -13., -11., -9., -7., -5., -3., -1., 1., 3., 5., 
        7., 9., 11., 13., 15., 20., 30., 50., 75., 100., 200],
    contour_level_selection_type= "level_list",
    contour_shade= "on",
    contour_shade_colour_list= ["rgb(0,0,0.3)", "rgb(0,0,0.5)", 
        "rgb(0,0,0.7)", "rgb(0,0,0.9)", "rgb(0,0.15,1)", 
        "rgb(0,0.3,1)", "rgb(0,0.45,1)", "rgb(0,0.6,1)", 
        "rgb(0,0.75,1)", "rgb(0,0.85,1)", "rgb(0.2,0.95,1)", 
        "rgb(0.45,1,1)", "rgb(0.75,1,1)", "none", "rgb(1,1,0)", 
        "rgb(1,0.9,0)", "rgb(1,0.8,0)", "rgb(1,0.7,0)", 
        "rgb(1,0.6,0)", "rgb(1,0.5,0)", "rgb(1,0.4,0)", 
        "rgb(1,0.3,0)", "rgb(1,0.15,0)", "rgb(0.9,0,0)", 
        "rgb(0.7,0,0)", "rgb(0.5,0,0)", "rgb(0.3,0,0)"],
    contour_shade_colour_method= "list",
    contour_shade_method= "area_fill")
legend = mlegend(legend='on', 
    legend_display_type='continuous', 
    legend_text_colour='charcoal',         
    legend_text_font_size=0.4, 
    legend_box_mode = "positional",
    legend_box_x_position = 27.00,
    legend_box_y_position = 3.00,
    legend_box_x_length = 2.00,
    legend_box_y_length = 13.00,
    legend_box_blanking = "on",
    legend_border = "on",
    legend_border_colour='charcoal')
title = mtext(
        text_lines= ['Example of Xsection to demonstrate the use of NetCDFnetCDF data...', 
        '<magics_title/>'],
        text_html= 'true',
        text_justification= 'left',
        text_font_size= 0.8,
        text_colour= 'charcoal',
        )

plot(output, projection, horizontal, vertical, data, contour, legend, title)


Column
width200px


...