What is VAPOR?
VAPOR stands for Visualization and Analysis Platform for Ocean, Atmosphere, and Solar Researchers. It is a software system providing an interactive 3D visualization environment that runs on most UNIX, Windows and Mac systems equipped with modern 3D graphics cards.
The home of the software is https://www.vapor.ucar.edu :
...
.
How to use VAPOR with Metview?
VAPOR has it its own internal data model and NWP data has to be converted into the VAPOR format. There are a set of VAPOR command line tools that can convert NetCDF input data into the VAPOR this format but there is no such tool available for GRIB.
Metview's VAPOR Prepare icon helps to overcome this difficulty and allows converting ECMWF GRIB data into the VAPOR format. Detailed instructions on how to use this icon can be found here.

Visualisation
Once the data conversion has been converted just right-click Visualise completed the VAPOR Prepare icon can be used to start up VAPOR with the newly created dataset
VAPOR data files
VAPOR input data is described by .vdf (VAPOR data Format) files. These are XML files containing the name and dimension all the variables and the path of the actual data files storing the data values. VAPOR stores its actual data values in .vdc (VAPOR Data Collection) files. These are NetCDF files containing wavelet compressed 3D data. There is a separate file for each variable and timestep organized into a folder hierarchy.
The input data must be defined on a 3D grid, which has to be regular horizontally. Vertically the grid can be:
- regular: equidistant
- layered: the height along a layer can change from point-to-point. The elevation above sea level of each layer has to be available as a variable called ELEVATION. VAPOR internally interpolate all the data to height levels.
- spherical: it is used for solar physics
VAPOR uses a right-handed coordinate system which means that :
- the horizontal grid has to start at the SW corner
- the vertical coordinates have to increase along the z axis (upwards).
...
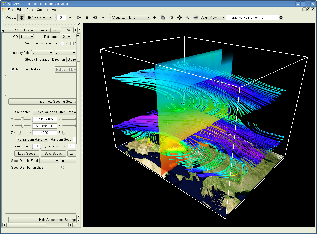
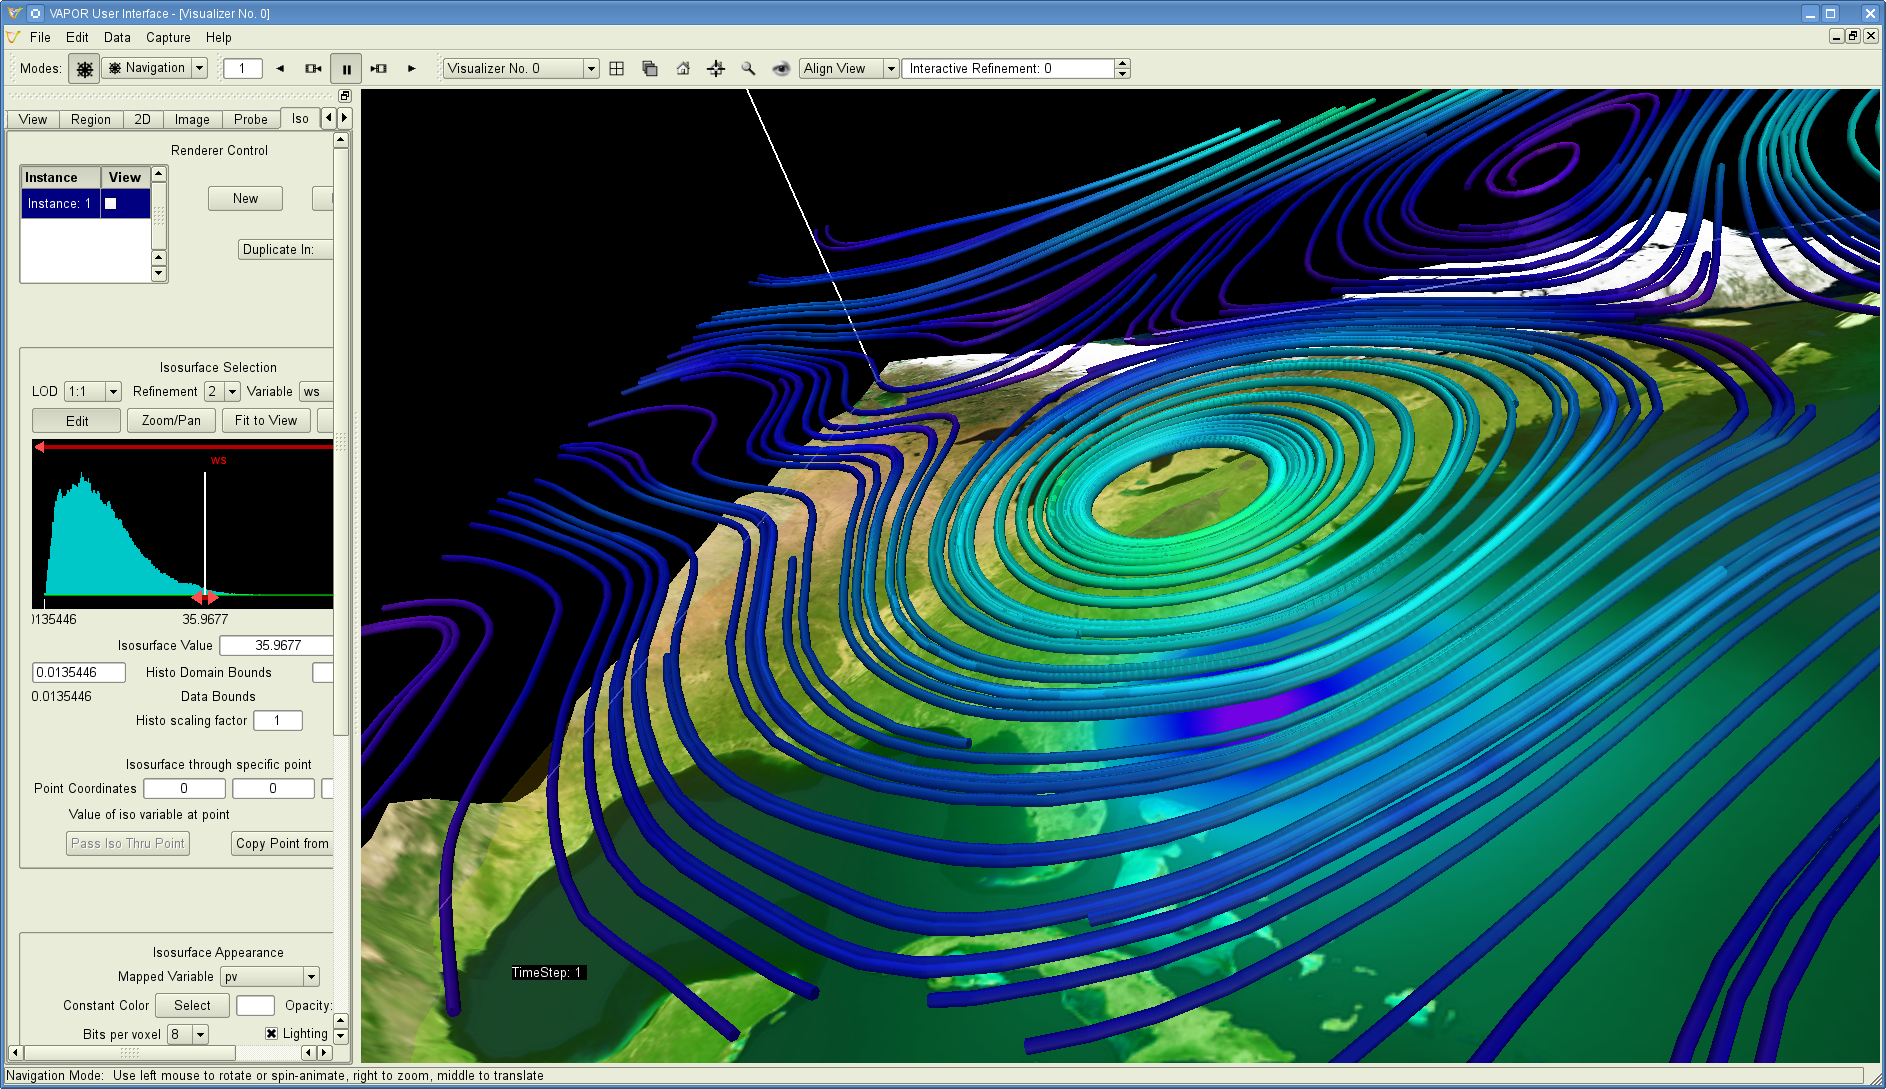
to provide interactive 3D visualisation for the data. The snapshots below show how ECMWF data is actually displayed in VAPOR.
Further details
There is a tutorial available on the use of VAPOR with Metview. It explains both the data preparation steps and the basics of the visualisation.
| Excerpt | ||
|---|---|---|
|