| Section |
|---|
| Column |
|---|
| 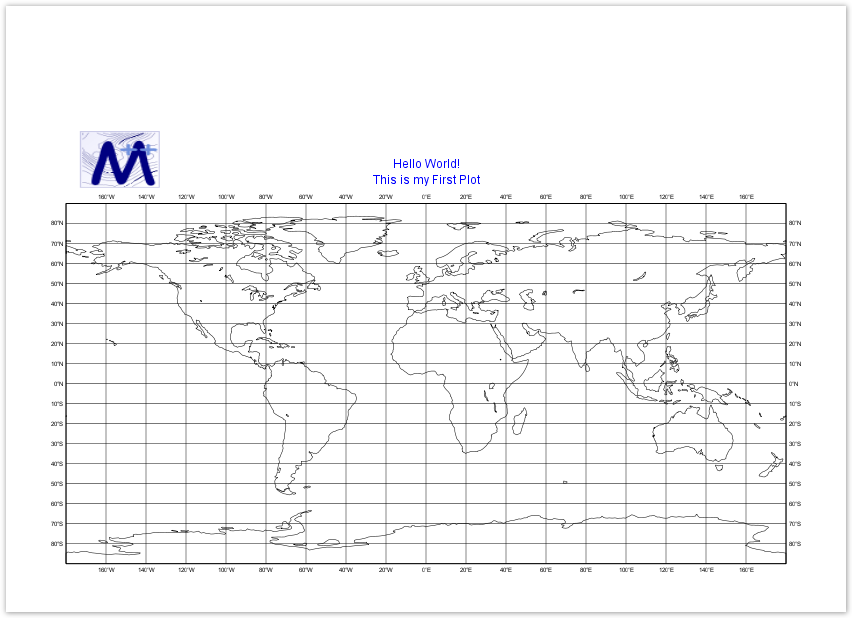 Image Removed Image Removed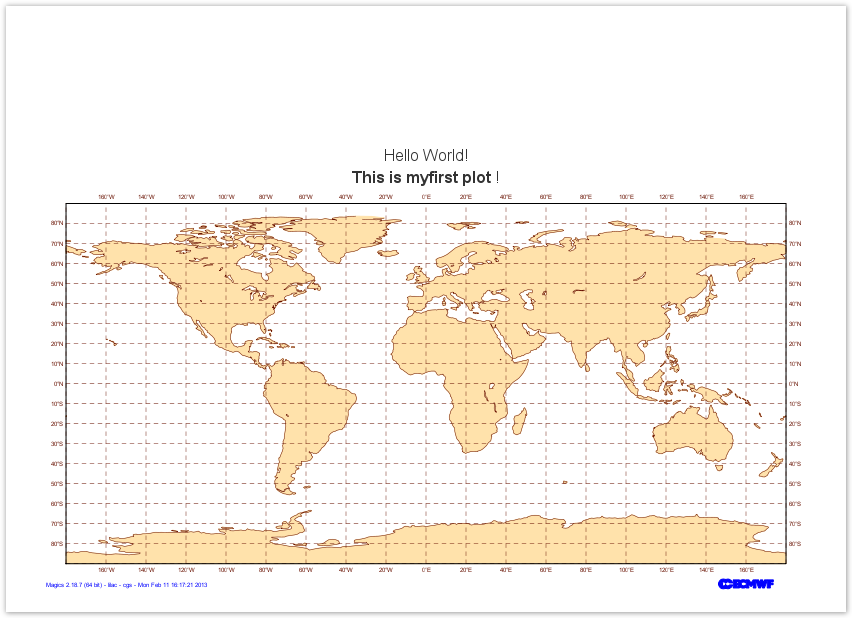 Image Added Image Added
|
| Column |
|---|
| | Panel |
|---|
| title | Check | List-list
- Create a Magics python skeleton that displays a global map using the plot command
- Create and use an output object to set-up name and format of your output
taylor - Add a mtext object to add some texts.
|
|---|
|
|
First step
In order to be able to create and use Magics objects, the Magics python package has to be imported.
Any Magics plot will be triggered using the plot command.
A basic plot could be a geographical map, using the default projection, and the default attributes of coastlines.
Magics will instantiate the default driver, a Postscript driver...
| Section |
|---|
| Column |
|---|
| | Code Block |
|---|
| language | python |
|---|
| theme | Confluence |
|---|
| title | Python - Output |
|---|
| collapse | true |
|---|
| from Magics.macro import *
#The default plot command will create a ps called ps.ps
plot(mcoast()) |
|
| Column |
|---|
|  Image Added Image Added
|
|
Setting the output
The object outputallows the definition of the output format, and the settings of the output file name .
Have a look at the PNG output documentation to see which parameters are available to set-up a PNG output.
To create a PNG output, you have to create an output object and to insert at the first position in the plot command
| Code Block |
|---|
| language | python |
|---|
| theme | Confluence |
|---|
| title | Python - Output |
|---|
| collapse | true |
|---|
|
from Magics.macro import *

#settings of the PNG output
output = output(
			output_formats = ['png'],
  			output_name = "magics",
    		output_name_first_page_number = "off"
    )

#The plot command will create a PNG output called magics.png
plot(output, mcoast()) |
Setting the coastlines
The object mcoast allows the parameterisation of the coastlines.
Have a look at the Coastlines documentation to see which parameters are available.
To configure the look of your coastlines you have to create a mcoast object with the parameters you want.
The mcoast object has to be inserted in the plot command.
| Section |
|---|
| Column |
|---|
| | Code Block |
|---|
| language | python |
|---|
| theme | Confluence |
|---|
| title | Python - Coastlines |
|---|
| collapse | true |
|---|
| from Magics.macro import *
#settings of the PNG output
output = output(
output_formats = ['png'],
output_name = "coast",
output_name_first_page_number = "off"
)
##settings of the coastlines attributes
coast = mcoast(
map_coastline_land_shade = "on",
map_coastline_land_shade_colour = "cream",
map_grid_line_style = "dash",
map_grid_colour = "brown",
map_label_colour = "brown",
map_coastline_colour = "brown"
)
#The plot command will now use the coast object
plot(output, coast) |
|
| Column |
|---|
|  Image Added Image Added |
|
Adding a text
Magics allows the user to add of or several lines of text. The position of the text is by default above the plot, but some parameters allow it to be moved around.
Have a look at the Text Plotting Documentation
A basic HTML formatting can be used for colour, style, and font size.
The mtext object has to be inserted in the plot command to see the text on the result.
| Section |
|---|
| Column |
|---|
| | Code Block |
|---|
| language | python |
|---|
| theme | Confluence |
|---|
| title | Python - Title |
|---|
| collapse | true |
|---|
| from Magics.macro import *
#settings of the PNG output
output = output(
output_formats = ['png'],
output_name = "coast",
output_name_first_page_number = "off"
)
##settings of the coastlines attributes
coast = mcoast(
map_coastline_land_shade = "on",
map_coastline_land_shade_colour = "cream",
map_grid_line_style = "dash",
map_grid_colour = "brown",
map_label_colour = "brown",
map_coastline_colour = "brown"
)
##settings of the text (notice the HTML formatting)
title = mtext(
text_lines = ["Hello World!", " <b>This is my first plot</b> !"],
text_font_size = "0.7",
text_colour = "charcoal"
)
#The plot command will now use the coast and title objects
plot(output, coast, title) |
|
| Column |
|---|
| 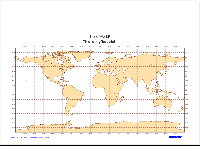 Image Added Image Added |
|
Go to next Step...
Go to the Main Magics Tutorial...