| Panel | |||||||||||||||||||||||||||||||||||
|---|---|---|---|---|---|---|---|---|---|---|---|---|---|---|---|---|---|---|---|---|---|---|---|---|---|---|---|---|---|---|---|---|---|---|---|
| title
|


Before you start ...
During this tutorial, you will use Python and Magics
...
First Step - warming up : the "Hello World" example
| Column | ||
|---|---|---|
| ||
|
...
| width | 50% |
|---|
++ on a Linux workstation.
Here is a list of basic commands you may want to use.
Basic UNIX commands:
- ls : list the files in the current directory
- mkdir my_exercise : create a directory called my_excercise
- cd my_exercise : go to the directory my_excercise. my_excercise becomes the current directory
Using an editor:
There are several editors available
- vi
- emacs
- kate
- nedit
- geany ( Python syntax highlighted..)
Run the python interpretor :
In this tutorial we are expecting you to create a python script using your favourite editor and run python to interpret it. Your system have been set-up already and you can use Magics and python by typing the single command:
python magics.py
Visualise your result:
Magics will generate a Postscript or a PNG output. To visualise the results, you can use one of the following commands:
- gv magics.ps : visualise a Postscript file called magics.ps
- display magics.png : visualise a PNG file called magics.png
- xv magics.png : visualise a PNG file called magics.png
First Step - warming up : the "Hello World" example
...
| Panel | ||||||||||||||||
|---|---|---|---|---|---|---|---|---|---|---|---|---|---|---|---|---|
| ||||||||||||||||
|
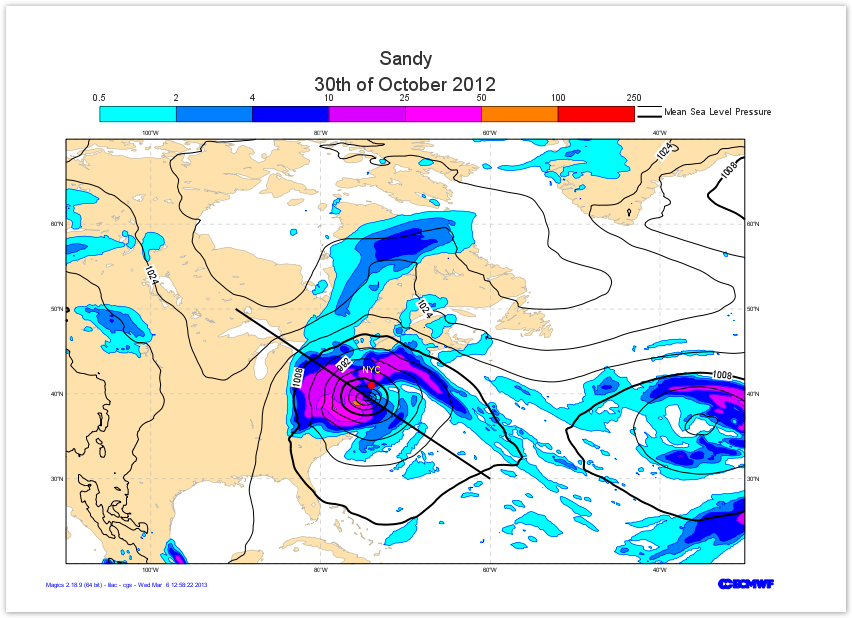
Second Step - a geographical map
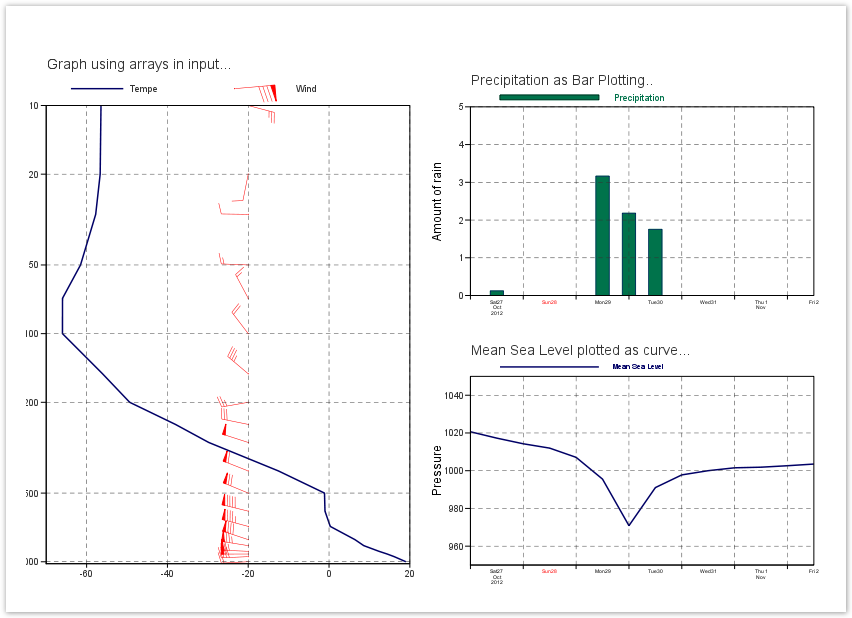
Third Step - a vertical profile and a Time serie
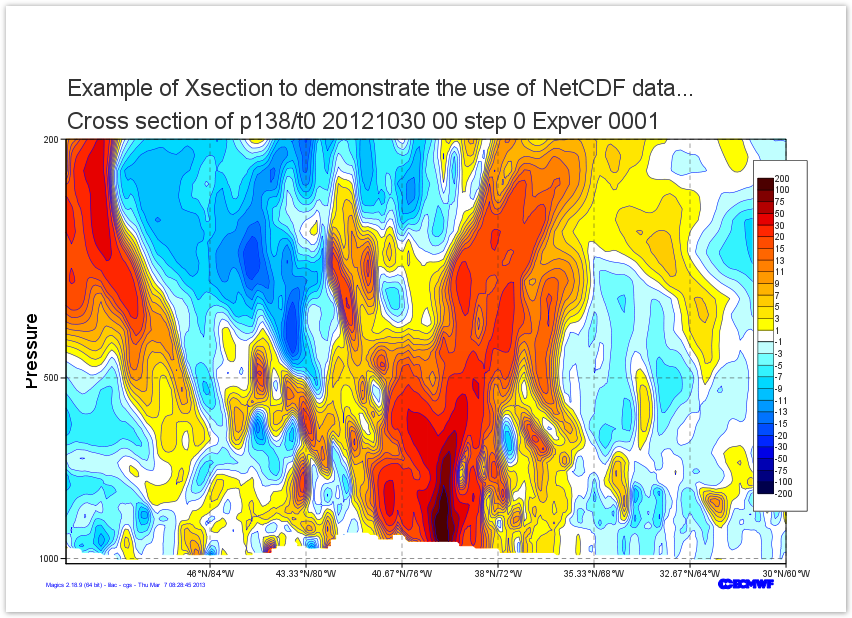
Fourth Step - a Cross Section
...
|
Second Step - a geographical map
| Panel | ||||||||||||
|---|---|---|---|---|---|---|---|---|---|---|---|---|
| ||||||||||||
|
Third Step - a Cross Section
| Panel | ||||||||||||
|---|---|---|---|---|---|---|---|---|---|---|---|---|
| ||||||||||||
|
Fourth Step - a vertical profile and a Time series
| Panel | ||||||||||||
|---|---|---|---|---|---|---|---|---|---|---|---|---|
| ||||||||||||
|
Fifth Step - More on Symbol Plotting
| Panel | ||||||||||||
|---|---|---|---|---|---|---|---|---|---|---|---|---|
| ||||||||||||
|
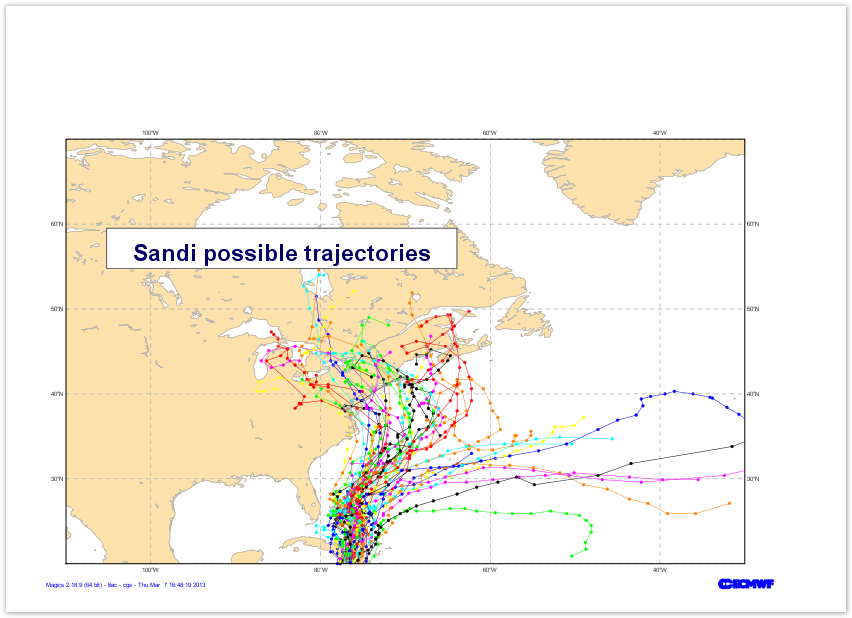
Finally - a complex layout
...
| Panel | ||||||||||||
|---|---|---|---|---|---|---|---|---|---|---|---|---|
| ||||||||||||
|
Download the full solution ...
...