...
Issued by: Ole Einar Tveito (MET Norway) and Cristian Lussana (MET Norway)
Issued Date: 3031/0903/20232024
Ref: M311_Lot3.3.1.2_NGCD_PUG_ver5
...
| Expand | |||||||||||||||||||||
|---|---|---|---|---|---|---|---|---|---|---|---|---|---|---|---|---|---|---|---|---|---|
| |||||||||||||||||||||
|
List of datasets covered by this document
| Expand | ||||||||||||||||||||||||
|---|---|---|---|---|---|---|---|---|---|---|---|---|---|---|---|---|---|---|---|---|---|---|---|---|
| ||||||||||||||||||||||||
|
Related documents
| Reference ID | Document | ||||||
|---|---|---|---|---|---|---|---|
D1
| NGCD Algorithm Theoretical Basis Document | ||||||
D2
| Climate and Forecast (CF) Conventions and Metadata; http://cfconventions.org | ||||||
D3
| R Core Team (2017). R: A language and environment for statistical computing. R Foundation for Statistical Computing, Vienna, Austria. URL https://www.R-project.org/ |
...
| Description | Link |
|---|---|
The historical archive for different versions is made available to users via the CDS | https://cds.climate.copernicus.eu/cdsapp#!/dataset/insitu-gridded-observations-nordic |
| The data are also available to users via MET Norway OPeNDAP access | https://thredds.met.no/thredds/catalog/ngcd/catalog.html |
| MET Norway. Historical archive ver. 2324.09 03 (for different versions, replace 2324.09 03 with the correct label) | https://thredds.met.no/thredds/catalog/ngcd/version_2324.0903/catalog.html |
| MET Norway. Provisional archive | https://thredds.met.no/thredds/catalog/ngcd/provisional/catalog.html |
...
The NGCD undergoes full updates biannually, specifically in March and September. Following each update, a new version is released, labeled as Year.Month (for instance, the September 2023 March 2024 update is designated as ver. 2324.0903). Semi-annual datasets released through the CDS will be publicly accessible for up to three years post-release. The latest version of this document pertains to NGCD ver. 2324.0903.
Every version consists of two distinct archives: i) the historical archive and ii) the provisional archive (provisional data for a particular version are deleted when superseded by a subsequent historical archive).
For ver. 2324.0903:
The historical archive encompasses the period from January 1961 to June December 2023. Any post-production modifications to the historical archive are documented in the "List of Known issues" and/or within the "Known Issues" section on the NGCD page on the MET Norway thredds server.
The provisional archive is exclusive to NGCD-2 files. It starts from 1st July 2023 January 2024 and is updated daily. This means that some files, typically the most recent ones, can vary daily without specific notice. The methodologies employed for the provisional products mirror those used for the NGCD-2 historical archive. However, the observation data used as input is sourced from the open data application programming interfaces of FMI, MET Norway, and SMHI. The provisional data from July January to December 2023 June 2024 will be superseded by the historical archive in the subsequent NGCD version.
For data access, please refer to the provided links in the "Data access information" section. A comprehensive description of NGCD is presented in the "Product information" section. Additionally, Appendix A details the evaluation for ver. 18.03, which is consistent with the methodologies employed for all versions up to ver. 2324.0903. Lastly, Appendix B showcases examples of file structures.
...
The time series illustrating the number of stations used to produce NGCD version 2324.09 03 are depicted in Figures 1-4, corresponding to RR, TG, TN and TX respectively. The number of RR stations in the region has decreased from approximately 2400 stations-per-day in 1980 to 1400 stations-per-day in 2020, marking a decline of about 42%. This number has further decreased by 2023. Conversely, for TG, the number of stations has been on the rise after 2010, growing from 800 stations-per-day in 2000 to slightly over 1300 stations-per-day in 2020, an increase of roughly 62%. This surge is primarily attributed to the integration of sub-regional networks in Norway, overseen by Norwegian public institutions. It's worth noting that the number of stations used for TG production after 2010 exhibits greater daily fluctuations compared to previous years. As for TX and TN, there's a steady decline in station numbers from 1971 to 1994. However, there's a resurgence and gradual increase from 1995 onwards. Between 1971 and 2020, the relative changes for TX and TN are less pronounced than for TG, with station numbers ranging from a low of about 700 to a high of 1000 stations-per-day, reflecting an increase of around 43%.
Anchor figure1 figure1

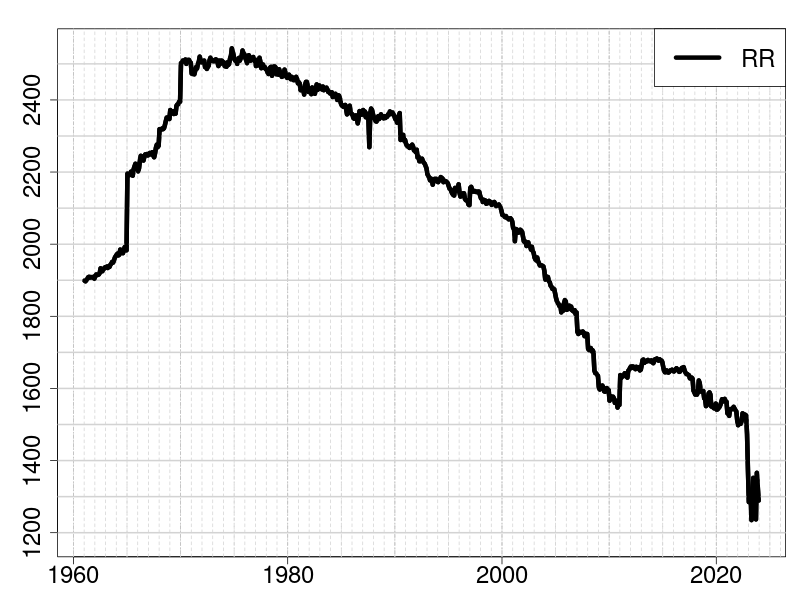
Figure 1: Daily precipitation total (RR): monthly time series of the number of stations used in the production of NGCD ver 2324.09 03 from January 1961 to June December 2023. For each month, the number of stations shown is the median of the stations available daily.
Anchor figure2 figure2


Figure 2: Daily mean temperature (TG): monthly time series of the number of stations used in the production of NGCD ver 2324.09 03 from January 1961 to June December 2023. For each month, the number of stations shown is the median of the stations available daily.
Anchor figure3 figure3


Figure 3: Daily minimum temperature (TN): monthly time series of the number of stations used in the production of NGCD ver 2324.09 03 from January 1961 to June December 2023. For each month, the number of stations shown is the median of the stations available daily.
Anchor figure4 figure4


Figure 4: Daily maximum temperature (TX): monthly time series of the number of stations used in the production of NGCD ver 2324.09 03 from January 1961 to June December 2023. For each month, the number of stations shown is the median of the stations available daily.
...
Regarding TN (and by implication, TX), the pattern echoes that of TG. However, a key distinction arises: until 2021, the observational network over Norway is relatively sparse. From 2021 onwards, a consistent observational network emerges for all temperature-related variables.
Anchor figure5 figure5

Figure 5: Daily precipitation total (RR): spatial distribution of the observing stations used in the production of NGCD when the observational network consists of a smaller number of stations (“sparse” observational network, top row) and a larger number of stations (“dense” observational network, bottom row) with respect to the the time series of available observations (see Figure 1). The left column shows maps over the domain while the right column shows the elevations of the stations (blue dots) as a function of their Northing coordinates. As a reference in the background, the gray dots are the elevations of the cells on the 1 km digital elevation model over Fennoscandia
Anchor figure6 figure6

Figure 6: Daily mean temperature (TG): spatial distribution of the observing stations used in the production of NGCD when the observational network consists of a smaller number of stations (“sparse” observational network, top row) and a larger number of stations (“dense” observational network, bottom row) with respect to the the time series of available observations (see Figure 2). The left column shows maps over the domain while the right column shows the elevations of the stations (red dots) as a function of their Northing coordinates. As a reference in the background, the gray dots are the elevations of the cells on the 1 km digital elevation model over Fennoscandia.
Anchor figure7 figure7

Figure 7: Daily minimum temperature (TN): spatial distribution of the observing stations used in the production of NGCD when the observational network consists of a smaller number of stations (“sparse” observational network, top row) and a larger number of stations (“dense” observational network, bottom row) with respect to the the time series of available observations (see Figure 3). The left column shows maps over the domain while the right column shows the elevations of the stations (green dots) as a function of their Northing coordinates. As a reference in the background, the gray dots are the elevations of the cells on the 1 km digital elevation model over Fennoscandia.
...
- <Var> is one of: RR, TG, TX and TN
- <Id_type> is either 1 or 2
- <ver> is the version label in the format Year.Month (e.g. 2324.0903)
- <Date> is in the form YYYYMMDD
...

Figure 9: Daily mean temperature (TG, oC) for 30 May 2021: NGCD-1 on the left; NGCD-2 on the right.
Anchor figure10 figure10


Figure 10: Daily minimum and maximum temperatures (TN top row, TX bottom row, oC) for 30 May 2021: NGCD-1 in the left column; NGCD-2 in the right column.
...
Appendix B - Example file structure
Example file structure can be seen directly from the web-browser at the following URLs.
Var | URL with example of file structure |
RR | |
TG | |
TX | |
TN |
References
Klein Tank, A. M., Wijngaard, J. B., Können, G. P., Böhm, R. , Demarée, G. , Gocheva, A. , Mileta, M., Pashiardis, S. , Hejkrlik, L. , Kern‐Hansen, C. , Heino, R. , Bessemoulin, P. , Müller‐Westermeier, G. , Tzanakou, M. , Szalai, S. , Pálsdóttir, T. , Fitzgerald, D. , Rubin, S. , Capaldo, M. , Maugeri, M. , Leitass, A. , Bukantis, A. , Aberfeld, R. , van Engelen, A. F., Forland, E. , Mietus, M. , Coelho, F. , Mares, C. , Razuvaev, V. , Nieplova, E. , Cegnar, T. , Antonio López, J. , Dahlström, B. , Moberg, A. , Kirchhofer, W. , Ceylan, A. , Pachaliuk, O. , Alexander, L. V. and Petrovic, P. (2002), Daily dataset of 20th‐century surface air temperature and precipitation series for the European Climate Assessment. Int. J. Climatol., 22: 1441-1453. doi:10.1002/joc.773
...