from Magics.macro import *
#setting the output
output = output(
output_formats = ['png'],
output_name = "xsect_step6",
output_name_first_page_number = "off"
)
# Setting the cartesian view
projection = mmap(
subpage_map_projection='cartesian',
subpage_x_axis_type='geoline',
subpage_y_axis_type='logarithmic',
subpage_x_min_latitude=50.,
subpage_x_max_latitude=30.,
subpage_x_min_longitude=-90.,
subpage_x_max_longitude=-60.,
subpage_y_min=1020.,
subpage_y_max=200.,
)
# Vertical axis
vertical = maxis(
axis_orientation='vertical',
axis_grid='on',
axis_type='logarithmic',
axis_tick_label_height=0.4,
axis_tick_label_colour='charcoal',
axis_grid_colour='charcoal',
axis_grid_thickness=1,
axis_grid_reference_line_style='solid',
axis_grid_reference_thickness=1,
axis_grid_line_style='dash',
axis_title='on',
axis_title_text='Pressure',
axis_title_height=0.6,
)
# Horizontal axis
horizontal = maxis(
axis_orientation='horizontal',
axis_type='geoline',
axis_tick_label_height=0.4,
axis_tick_label_colour='charcoal',
axis_grid='on',
axis_grid_colour='charcoal',
axis_grid_thickness=1,
axis_grid_line_style='dash',
)
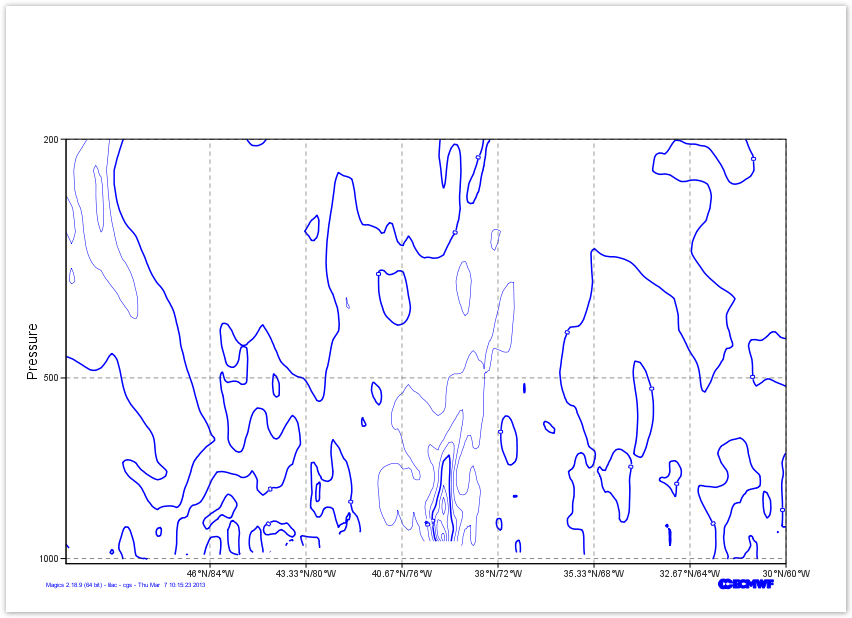
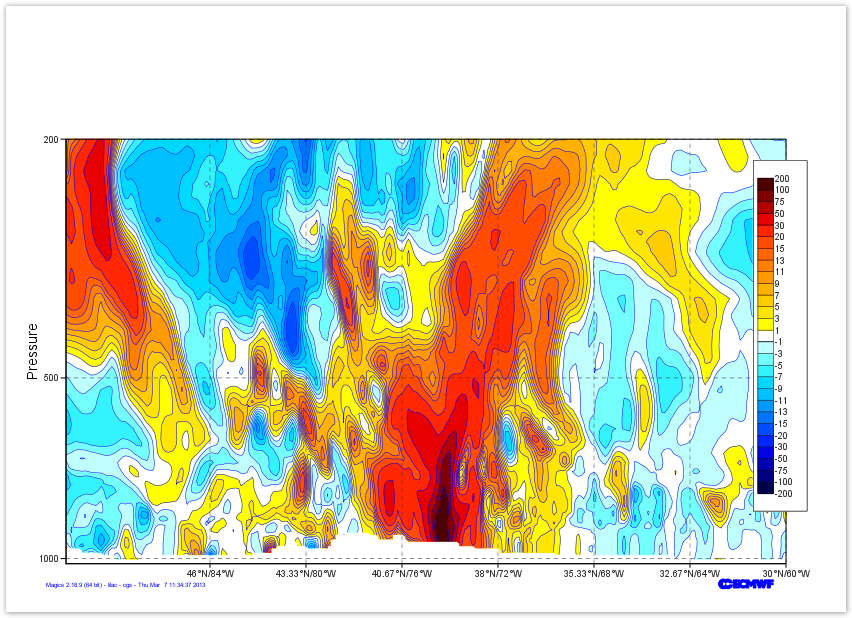
# Definition of the netCDF data and interpretation
data = mnetCDFmnetcdf(netCDFnetcdf_filename = "section.nc",
netCDFnetcdf_value_variable = "p13820121030000000000001",
netCDFnetcdf_field_scaling_factor = 100000.,
netCDFnetcdf_y_variable = "levels",
netCDFnetcdf_x_variable = "longitude",
netCDFnetcdf_x_auxiliary_variable = "latitude"
)
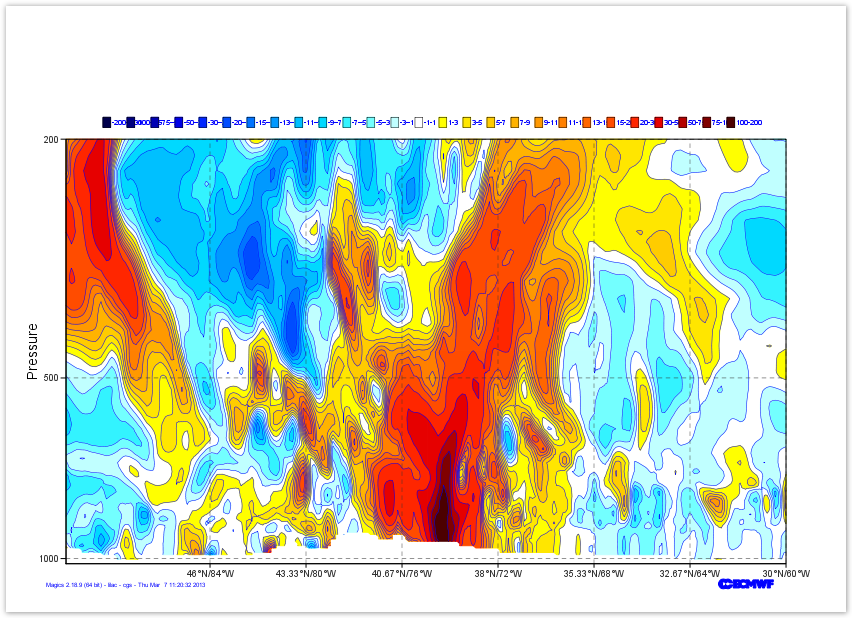
contour = mcont(contour_highlight= "off",
contour_hilo= "off",
contour_label= "off",
legend='on',
contour_level_list= [-200., -100., -75., -50., -30., -20.,
-15., -13., -11., -9., -7., -5., -3., -1., 1., 3., 5.,
7., 9., 11., 13., 15., 20., 30., 50., 75., 100., 200],
contour_level_selection_type= "level_list",
contour_shade= "on",
contour_shade_colour_list= ["rgb(0,0,0.3)", "rgb(0,0,0.5)",
"rgb(0,0,0.7)", "rgb(0,0,0.9)", "rgb(0,0.15,1)",
"rgb(0,0.3,1)", "rgb(0,0.45,1)", "rgb(0,0.6,1)",
"rgb(0,0.75,1)", "rgb(0,0.85,1)", "rgb(0.2,0.95,1)",
"rgb(0.45,1,1)", "rgb(0.75,1,1)", "none", "rgb(1,1,0)",
"rgb(1,0.9,0)", "rgb(1,0.8,0)", "rgb(1,0.7,0)",
"rgb(1,0.6,0)", "rgb(1,0.5,0)", "rgb(1,0.4,0)",
"rgb(1,0.3,0)", "rgb(1,0.15,0)", "rgb(0.9,0,0)",
"rgb(0.7,0,0)", "rgb(0.5,0,0)", "rgb(0.3,0,0)"],
contour_shade_colour_method= "list",
contour_shade_method= "area_fill")
legend = mlegend(legend='on',
legend_display_type='continuous',
legend_text_colour='charcoal',
legend_text_font_size=0.4,
legend_box_mode = "positional",
legend_box_x_position = 27.00,
legend_box_y_position = 3.00,
legend_box_x_length = 2.00,
legend_box_y_length = 13.00,
legend_box_blanking = "on",
legend_border = "on",
legend_border_colour='charcoal')
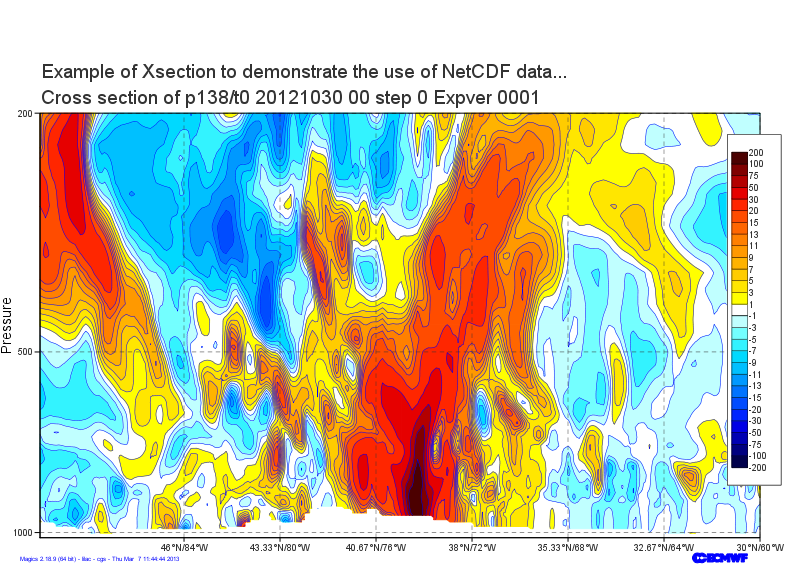
title = mtext(
text_lines= ['Example of Xsection to demonstrate the use of netCDF data...',
'<magics_title/>'],
text_html= 'true',
text_justification= 'left',
text_font_size= 0.8,
text_colour= 'charcoal',
)
plot(output, projection, horizontal, vertical, data, contour, legend, title) |