The CDS API is a Python service that enables access to CEMS-Flood data on the CDS. It is ideal for users that retrieve large volumes of data or need to automate tasks. This page collects a number of scripts that can work as blueprints for more user-specific requests.
| Info | ||
|---|---|---|
|
Table of Contents
| |
Instructions |
...
about the installation and set-up of the CDS API can be found |
...
API script examples:
EFAS Medium-range climatology
...
| language | py |
|---|
...
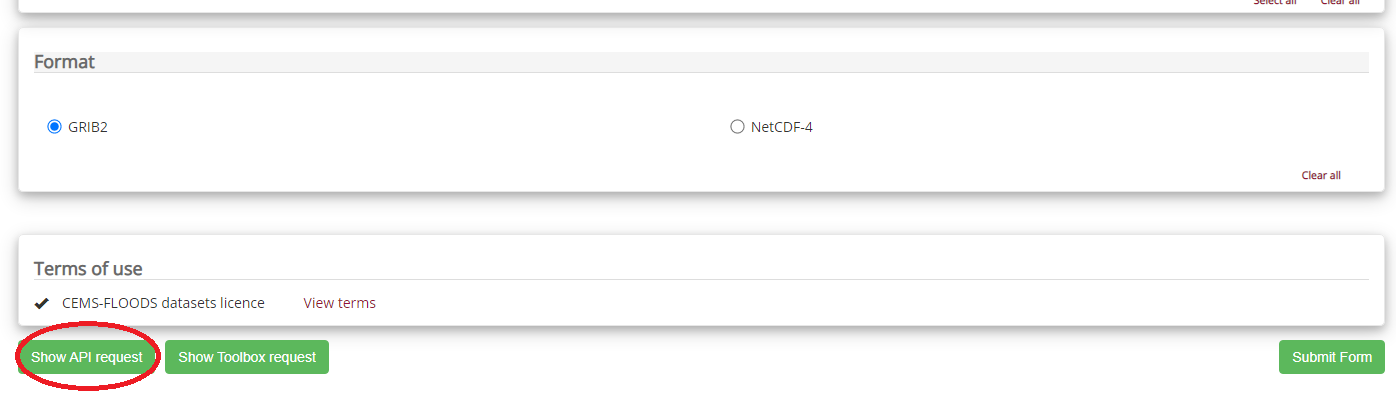
A user will indicate the data they wish to download by using the radio buttons on the 'Data Download' tab of their chosen dataset on the CDS. After a selection is made on the form, to generate the API request click the 'Show API request' button. This will show the python code to be used to download the data of the bottom of the form.
| Info | |||||||
|---|---|---|---|---|---|---|---|
| |||||||
You should copy the content of the script into a python file (ex: retrieve_<dataset>.py) and then launch it from a terminal:
|
Table of Contents
API script examples:
The following are some examples of API scripts to download the various CEMS-Floods datasets from the CDS.
EFAS Medium-range climatology
| Code Block | ||||
|---|---|---|---|---|
| ||||
## === retrieve EFAS Medium-Range Climatology === import cdsapi if __name__ == '__main__': c = cdsapi.Client() VARIABLES = [ 'river_discharge_in_the_last_6_hours', 'snow_depth_water_equivalent', ] YEARS = ['%02d'%(mn) for mn in range(1991,2022)] MONTHS = ['january', 'february', 'march', 'april', 'may', 'june', 'july', 'august', 'september', 'october', 'november', 'december'] DAYS = ['%02d'%(mn) for mn in range(1,32)] for variable in VARIABLES: for year in YEARS: c.retrieve( 'efas-historical', { 'system_version': 'version_4_0', 'variable': variable, 'model_levels': 'surface_level', 'hyear': '1991', 'hmonth': MONTHS, 'hday': DAYS, 'time': '00:00', 'format': 'grib', }, f'efas_historical_{variable}_{year}.grib') |
EFAS Medium-range forecast
| Code Block | ||||
|---|---|---|---|---|
| ||||
## === retrieve EFAS Medium-Range Forecast ===

import cdsapi
import datetime


def compute_dates_range(start_date,end_date,loop_days=True):


    start_date = datetime.date(*[int(x) for x in start_date.split('-')])

    end_date = datetime.date(*[int(x) for x in end_date.split('-')])

    ndays =  (end_date - start_date).days + 1

    dates = []
    for d in range(ndays):
        dates.append(start_date + datetime.timedelta(d))

    if not loop_days:
        dates = [i for i in dates if i.day == 1]
    else:
        pass
    return dates


if __name__ == '__main__':


    # start the client
    c = cdsapi.Client()


    # user inputs
    START_DATE = '2020-10-14' # first date with available data

    END_DATE = '2021-02-28'

    LEADTIMES =  [str(lt) for lt in range(0,372,6)]


    # loop over dates and save to disk

    dates = compute_dates_range(START_DATE,END_DATE)

    for date in dates:

        year  = date.strftime('%Y')
        month = date.strftime('%m')
        day   = date.strftime('%d')

        print(f"RETRIEVING: {year}-{month}-{day}")

        c.retrieve('efas-forecast',
            {
                'format': 'grib',
                'originating_centre':'ecmwf',
                'product_type':'ensemble_perturbed_forecasts',
                'variable': 'river_discharge_in_the_last_6_hours',
                'model_levels': 'surface_level',
                'year': year,
                'month': month,
                'day': day,
                'leadtime_hour':LEADTIMES,
                'time': '12:00',
            },
f'efas_forecast_{year}_{month}_{day}.grib') |
GloFAS Medium-range climatology
| Code Block | ||||
|---|---|---|---|---|
| ||||
## === retrieve GloFAS Medium-Range Climatology ===

import cdsapi


if __name__ == '__main__':
    c = cdsapi.Client()


    YEARS  = ['%02d'%(mn) for mn in range(1979,2021)]

    MONTHS = ['january', 'february', 'march', 'april', 'may', 'june', 'july', 'august', 'september', 'october', 'november', 'december']
    DAYS   = ['%02d'%(mn) for mn in range(1,32)]


    for year in YEARS:
        c.retrieve(
            'cems-glofas-historical',
            {
                'system_version':'version_2_1',
                'product_type': 'consolidated',
                'hydrological_model': 'htessel_lisflood',
                'variable': 'river_discharge_in_the_last_24_hours',
                'hyear': year,,
                'hmonth': MONTHS,
                'hday': DAYS,,
                'format': 'grib',
            },
f'glofas_historical_{year}.grib') |
GloFAS Medium-range forecast
| Code Block | ||||
|---|---|---|---|---|
| ||||
## === retrieve GloFAS Medium-Range Forecast ===

import cdsapi
import datetime
import warnings


def compute_dates_range(start_date,end_date,loop_days=True):


    start_date = datetime.date(*[int(x) for x in start_date.split('-')])

    end_date = datetime.date(*[int(x) for x in end_date.split('-')])

    ndays =  (end_date - start_date).days + 1

    dates = []
    for d in range(ndays):
        dates.append(start_date + datetime.timedelta(d))

    if not loop_days:
        dates = [i for i in dates if i.day == 1]
    else:
        pass
    return dates


if __name__ == '__main__':


    # start the client
    c = cdsapi.Client()


    # user inputs
    START_DATE = '2019-11-05' # first date with available data

    END_DATE = '2021-03-15'

    LEADTIMES =  [str(lt) for lt in range(24,744,24)]


    # loop over dates and save to disk

    dates = compute_dates_range(START_DATE,END_DATE)

    for date in dates:

        year  = date.strftime('%Y')
        month = date.strftime('%m')
        day   = date.strftime('%d')

        print(f"RETRIEVING: {year}-{month}-{day}")

        c.retrieve(
            'cems-glofas-forecast',
            {
                'format': 'grib',
                'system_version':'operational',
                'hydrological_model': 'htessel_lisflood',
                'product_type':'ensemble_perturbed_forecasts',
                'variable': 'river_discharge_in_the_last_24_hours',
                'year': year,
                'month': month,
                'day': day,
                'leadtime_hour':LEADTIMES
            },
f'glofas_forecast_{year}_{month}_{day}.grib') |
GloFAS Medium-range
...
reforecast
| Code Block | ||||
|---|---|---|---|---|
| ||||
## === retrieve GloFAS Medium-Range Reforecast === ## === subset India, Pakistan, Nepal and Bangladesh region === |
...
import cdsapi from datetime import datetime, timedelta def get_monthsdays(): start, end = datetime(2019, 1, 1), datetime(2019, 12, 31) days = [start + timedelta(days=i) for i in range((end - start).days + 1)] monthday = [d.strftime("%B-%d").split("-") for d in days if d.weekday() in [0,3] ] |
...
return monthday MONTHSDAYS = get_monthsdays() if __name__ == '__main__': c = cdsapi.Client() # user inputs |
...
BBOX = [40.05 ,59.95, 4.95, 95.05] # North West South East YEARS = ['%d'%(y) for y in range(1999,2019)] LEADTIMES = ['%d'%(l) for l in range(24,1128,24)] # submit request for md in MONTHSDAYS: month = md[0].lower() day = md[1] c.retrieve( 'cems-glofas-reforecast', { 'system_version': 'version_2_2', 'variable': 'river_discharge_in_the_last_24_hours', 'format': 'grib', 'hydrological_model': 'htessel_lisflood', 'product_type': 'control_reforecast', |
...
'area': BBOX,# < - subset 'hyear': YEARS, 'hmonth': month , 'hday': day , 'leadtime_hour': |
...
GloFAS Medium-range reforecast (download time series)
The script shows how to retrieve the control reforecasts product from year 1999 to 2018, relative to the date 2019-01-03, for two station coordinates, one on the river network of the Thames and the other one on the Po river.
| Code Block | ||
|---|---|---|
| ||
import cdsapi
from datetime import datetime, timedelta


def get_monthsdays(start =[2019,1,1],end=[2019,12,31]):
    # reforecast time index
    start, end = datetime(*start),datetime(*end)
    days = [start + timedelta(days=i) for i in range((end - start).days + 1)]
    monthday = [d.strftime("%B-%d").split("-")  for d in days if d.weekday() in [0,3] ]

    return monthday

# get date index
MONTHSDAYS = get_monthsdays()

if __name__ == '__main__':
    c = cdsapi.Client()


    # set station coordinates (lat,lon)
    COORDS = {
            "Thames":[51.35,-0.45],
            "Po":[44.85, 11.65]
            }

    # select all years
    YEARS  = ['%d'%(y) for y in range(1999,2019)]

    # select all leadtime hours
    LEADTIMES = ['%d'%(l) for l in range(24,1128,24)]

    # loop over date index
    for md in MONTHSDAYS:

        month = md[0].lower()
        day = md[1]

		# loop over coordinates
        for station in COORDS:

            station_point_coord = COORDS[station]*2 # coordinates input for the area keyword

            c.retrieve(
                'cems-glofas-reforecast',
                {
                    'system_version': 'version_2_2',
                    'variable': 'river_discharge_in_the_last_24_hours',
                    'format': 'grib',
                    'hydrological_model': 'htessel_lisflood',
                    'product_type': 'control_reforecast',
                    'area':station_point_coord,
                    'hyear': YEARS,
                    'hmonth': month ,
                    'hday': day ,
                    'leadtime_hour': LEADTIMES,
                },
f'glofas_reforecast_{station}_{month}_{day}.grib') |
Plot retrieved data:
| Code Block | ||
|---|---|---|
| ||
import xarray as xr
import numpy as np
import matplotlib.pyplot as plt

YEARS = range(1999,2019)

# read dataset
ds = xr.open_dataset("glofas_reforecast_Po_january_03.grib",engine="cfgrib")
da = ds.isel(latitude=0,longitude=0).dis24

# plotting parameters
n = len(YEARS)
colors = plt.cm.jet(np.linspace(0,1,n))
ls = ["-","--",":"]

# plot
fig,ax = plt.subplots(1,1,figsize=(16,8))

steps = list(range(24,dsa.shape[1]*24+24,24))

for i,year in enumerate(YEARS):
    y = da.sel(time=f"{year}-01-03").values
    ax.plot(steps,y,label=f"{year}-01-03",color=colors[i],ls=ls[i%3])
    plt.legend(bbox_to_anchor=(0.9,-0.1),ncol=7)

ax.set_xlim([0,steps[-1]])
ax.set_xlabel("leadtime hours")
ax.set_ylabel("m**3 s**-1")

plt.title(f"Po river discharge at {float(ds.latitude.values),round(float(ds.longitude.values),2)}") |


GloFAS Medium-range reforecast (download time series for an event)
This script shows how to retrieve a point time series reforecast on the river Thames for a single forecast reference time, specifically the 11th of July 2007.
| Code Block | ||
|---|---|---|
| ||
import cdsapi
from datetime import datetime, timedelta


def get_monthsdays(start =[2019,1,1],end=[2019,12,31]):
    # reforecast time index
    start, end = datetime(*start),datetime(*end)
    days = [start + timedelta(days=i) for i in range((end - start).days + 1)]
    monthday = [d.strftime("%B-%d").split("-")  for d in days if d.weekday() in [0,3] ]

    return monthday


if __name__ == '__main__':
    c = cdsapi.Client()


    # station coordinates (lat,lon)
    COORDS = {
            "Thames":[51.35,-0.45]
            }

    # select date index corresponding to the event
    MONTHSDAYS = get_monthsdays(start =[2019,7,11],end=[2019,7,11])

    YEAR  = '2007'

    LEADTIMES = ['%d'%(l) for l in range(24,1128,24)]

    # loop over date index (just 1 in this case)
    for md in MONTHSDAYS:

        month = md[0].lower()
        day = md[1]

        # loop over station coordinates
        for station in COORDS:

            station_point_coord = COORDS[station]*2 # coordinates input for the area keyword

            c.retrieve(
                'cems-glofas-reforecast',
                {
                    'system_version': 'version_2_2',
                    'variable': 'river_discharge_in_the_last_24_hours',
                    'format': 'grib',
                    'hydrological_model': 'htessel_lisflood',
                    'product_type': ['control_reforecast','ensemble_perturbed_reforecasts'],
                    'area':station_point_coord,
                    'hyear': YEAR,
                    'hmonth': month ,
                    'hday': day ,
                    'leadtime_hour': LEADTIMES,
                },
                f'glofas_reforecast_{station}_{month}_{day}.grib')
|
In July 2007 a series of flooding events hit the UK, in particular in some areas of the upper Thames catchment up to 120 mm of rain fell between 19th and 20th of July.

Plot retrieved data:
| Code Block | ||
|---|---|---|
| ||
import xarray as xr
import pandas as pd
import matplotlib.pyplot as plt
import matplotlib.dates as mdates
from datetime import datetime,timedelta

forecast_reference_time = datetime(2017,7,11)

# read perturbed ensembles (dataType:pf)
ds = xr.open_dataset("glofas_reforecast_Thames_july_11.grib",engine="cfgrib",backend_kwargs={'filter_by_keys':{'dataType': 'pf'}})
da = ds.isel(latitude=0,longitude=0).dis24

# read control (dataType:cf)
cds = xr.open_dataset("glofas_reforecast_Thames_july_11.grib",engine="cfgrib",backend_kwargs={'filter_by_keys':{'dataType': 'cf'}})
cda = cds.isel(latitude=0,longitude=0).dis24


start = forecast_reference_time
end = start + timedelta(45)
time = pd.date_range(start,end)

# plotting parameters
ls = ["-","--",":"]
locator = mdates.AutoDateLocator(minticks=2, maxticks=46)
formatter = mdates.DateFormatter("%b-%d")

# plot

fig,ax = plt.subplots(1,1,figsize=(16,8))
ax.plot(time,cda.values,label=f"control",color="red")
for i,number in enumerate(range(0,10)):
    y = da.isel(number=number).values
    ax.plot(time,y,label=f"ensemble {number}",color=colors[i],ls=ls[i%3])
    plt.legend(bbox_to_anchor=(1,1),ncol=2)

ax.axvspan(datetime(2017,7,19), datetime(2017,7,21), alpha=0.3, color='blue') # highlight event
ax.set_xlabel("date")
ax.set_ylabel("m**3 s**-1")
ax.xaxis.set_major_locator(locator)
ax.xaxis.set_major_formatter(formatter)
ax.set_xlim([time[0],time[-1]])
plt.annotate("peak\nrainfall\nevent",(datetime(2017,7,19,3),85),rotation=0)
plt.xticks(rotation=70)
plt.title(f"Forecast reference time: 11-07-2007 - Thames river discharge at {float(ds.latitude.values),round(float(ds.longitude.values-360),2)}") |

GloFAS Seasonal Forecast (with example area subset)
...
| language | py |
|---|
 LEADTIMES,
            },
f'glofas_reforecast_{month}_{day}.grib') |
GloFAS Seasonal forecast
| Code Block | ||||
|---|---|---|---|---|
|
## === retrieve GloFAS Seasonal Forecast === ## === subset South America/Amazon region === |
...
import cdsapi if __name__ == '__main__': c = cdsapi.Client() YEARS = ['%d'%(y) for y in range(2020,2022)] MONTHS = ['%02d'%(m) for m in range(1,13)] LEADTIMES = ['%d'%(l) for l in range(24,2976,24)] for year in YEARS: for month in MONTHS: c.retrieve( 'cems-glofas-seasonal', { |
...
                'variable': 'river_discharge_in_the_last_24_hours',
                'format': 'grib',
                'year': year,
                'month': '12' if year == '2020' else month,
                'leadtime_hour': LEADTIMES,
|
...
'area': [ 10.95, -90.95, -30.95, -29.95 ] }, f'glofas_seasonal_{year}_{month}.grib') |
GloFAS Seasonal
...
reforecast
| Code Block | ||||
|---|---|---|---|---|
| ||||
## === retrieve GloFAS Seasonal Reforecast === ## === subset South America/Amazon region === |
...
import cdsapi if __name__ == '__main__': c = cdsapi.Client() YEARS = ['%d'%(y) for y in range(1981,2021)] MONTHS = ['january', 'february', 'march', 'april', 'may', 'june', 'july', 'august', 'september', 'october', 'november', 'december'] LEADTIMES = ['%d'%(l) for l in range(24,2976,24)] for year in YEARS: for month in MONTHS: c.retrieve( 'cems-glofas-seasonal-reforecast', { 'system_version': 'version_2_2', 'variable':'river_discharge_in_the_last_24_hours', 'format':'grib', 'hydrological_model':'htessel_lisflood', 'hyear': year, 'hmonth': month, 'leadtime_hour': LEADTIMES, 'area': [ 10.95, -90.95, -30.95, -29.95 ] }, |
...
f'glofas_seasonal_reforecast_{year}_{month}.grib') |