| Panel |
|---|
| Section |
|---|
| | Panel |
|---|
|
Objectives of the tutorial
At the end of this tutorial, you will be able to: - write and run small Magics python programs.
- create meteorological maps using different projections, or Cartesian projections
load gribGRIB, netcdfnetCDF, or simple ascii ASCII data - use the different action routines contour, wind, graph to visualise them
- add text and legend
- create a complex layout to get organise your plots
- find your way in the documentation
In short, when you will have realised this plot you will have understood the main concepts of MagicsThe slides of the course can be found here [PDF].
Quick Links
Hello World A Geographical Map A Cross Section Vertical Profile and time series More on Symbol Plotting A Complex Layout |
| Column |
|---|
|  Image Added Image Added
|
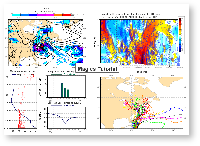 Image Removed Image Removed when will , you will have understood and used the main concepts of Magic |
|
|
|
Before you start ...
During this tutorial, you will use Python and Magics++ on a Linux workstation.
Here is a list of basic commands you may want to use.
Basic UNIX commands:
- ls : list the files in the current directory
- mkdir my_exercise : create a directory called my_excercise
- cd my_exercise :
...
- go to the directory my_excercise. my_excercise becomes the current directory
Using an editor:
There are several editors available
- vi
- emacs
- kate
- nedit
- geany ( Python syntax highlighted..)
Run the python interpretor :
In this tutorial we are expecting you to create a python script using your favourite editor and run python to interpret it. Your system have been set-up already and you can use Magics and python by typing the single command:
python magics.py
Visualise your result:
Magics will generate a Postscript or a PNG output. To visualise the results, you can use one of the following commands:
- gv magics.ps : visualise a Postscript file called magics.ps
- display magics.png : visualise a PNG file called magics.png
- xv magics.png : visualise a PNG file called magics.png
...
First Step - warming up : the "Hello World" example
...
| Panelsection |
|---|
|
| Column |
|---|
| 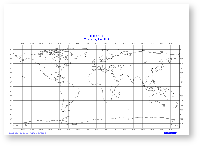 Image Removed Image Removed
|
|
|---|
| Column |
|---|
| | Panel |
|---|
| - get
Get familiar with the environment - find
Find your favourite editor to edit your python Python script - understand the basic Magics concepts
Create your first Magics script Learn learn how to: - run Run your programscript
- see See your results
- modify Modify your script
|
|
|
| Column |
|---|
| 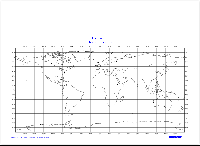 Image Added Image Added
|
|
|
...
Second Step - a geographical map
| Panel |
|---|
|
| Section |
|---|
| Column |
|---|
| 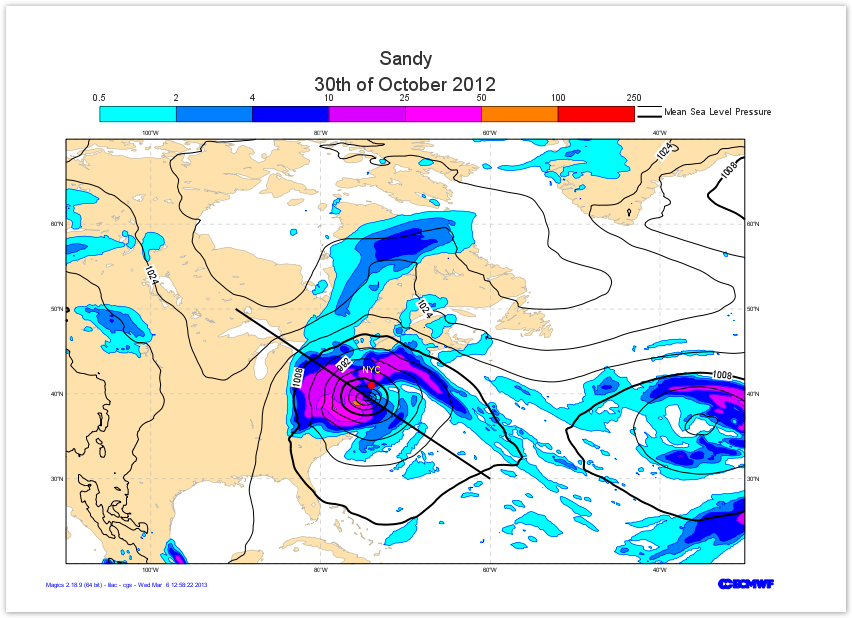 Image Added Image Added
|
|
|
Third Step - a Cross Section
| Panel |
|---|
|
| Section |
|---|
| Column |
|---|
| 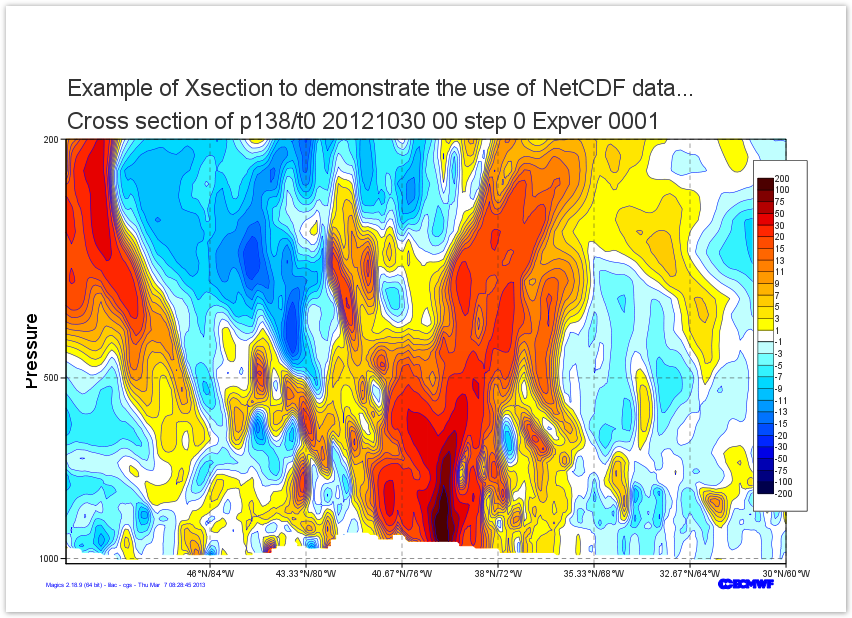 Image Added Image Added
|
|
|
Fourth Step - a vertical profile and a Time
...
Fourth Step - a Cross Section
Fifth Step - a advanced symbol plotting
Finally - a complex layout
series
| Panel |
|---|
|
| Section |
|---|
| Column |
|---|
| 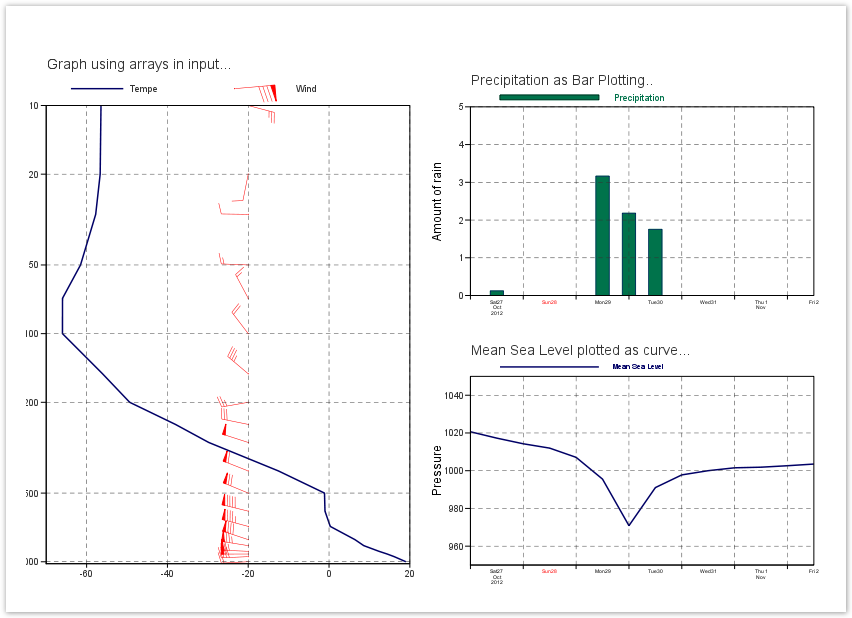 Image Added Image Added
|
|
|
Fifth Step - More on Symbol Plotting
| Panel |
|---|
|
| Section |
|---|
| Column |
|---|
|
Learn how to - Create a long list of visualisation
- Load and use CSV files
Go to Tutorial... |
| Column |
|---|
| 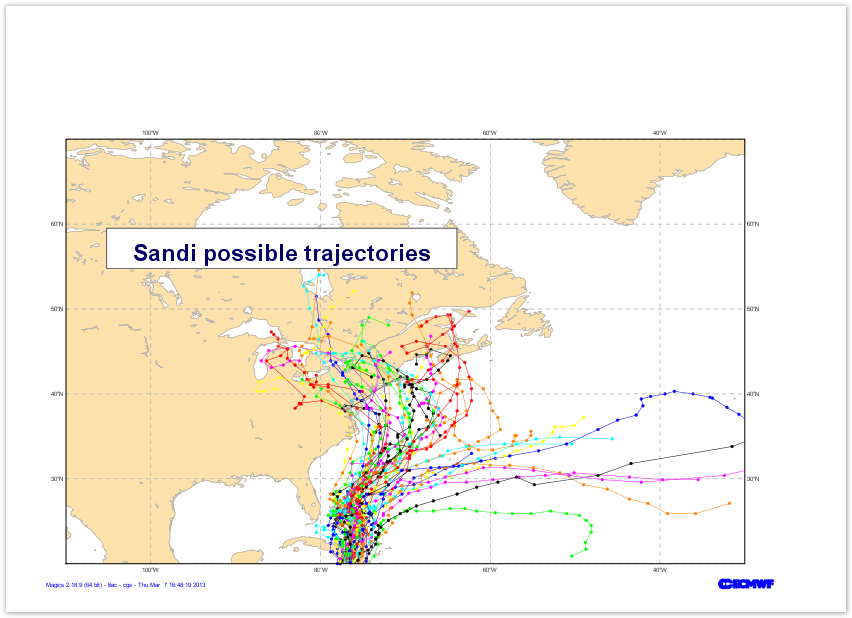 Image Added Image Added
|
|
|
Finally - a complex layout
| Panel |
|---|
|
| Section |
|---|
| Column |
|---|
| - Create a complex layout to put all these maps together
- Understand the notion of page and sub page
Go to Tutorial... |
| Column |
|---|
| Image Added |
|
|
Download the full solution ...
...