Status:Ongoing analysis Material Status: Finalised Material from: Ivan, Linus
...
| Show If | ||
|---|---|---|
| ||
Discussed in the following Daily reports: |
Picture
1. Impact
| Excerpt |
|---|
During the first week of January the north-eastern central and south-eastern part of Europe was hit by a cold spell resulting in temperatures below 40C in Sweden and Finland and temperatures below 30C far down on the continent. In connection, many countries in southern and south-eastern Europe (e.g Italy, Greece and Turkey) were hit by severe snowfall. |
http://www.bbc.co.uk/news/world-europe-38546998
...
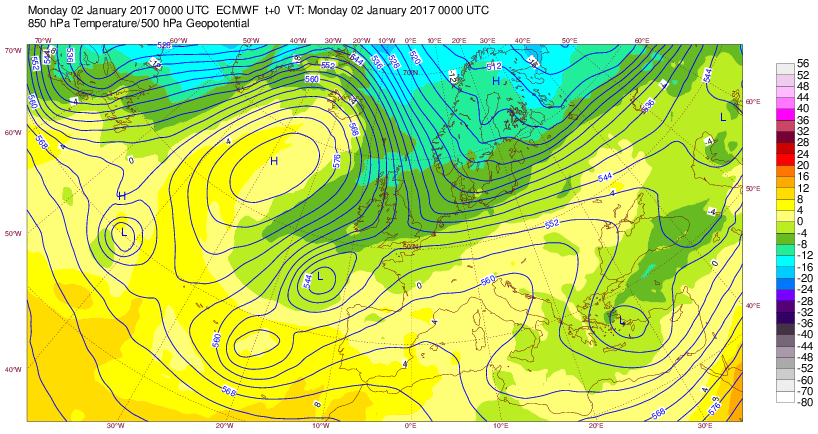
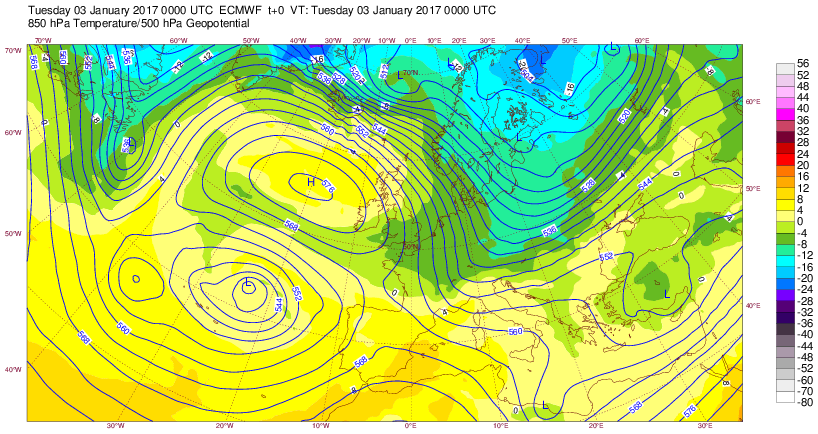
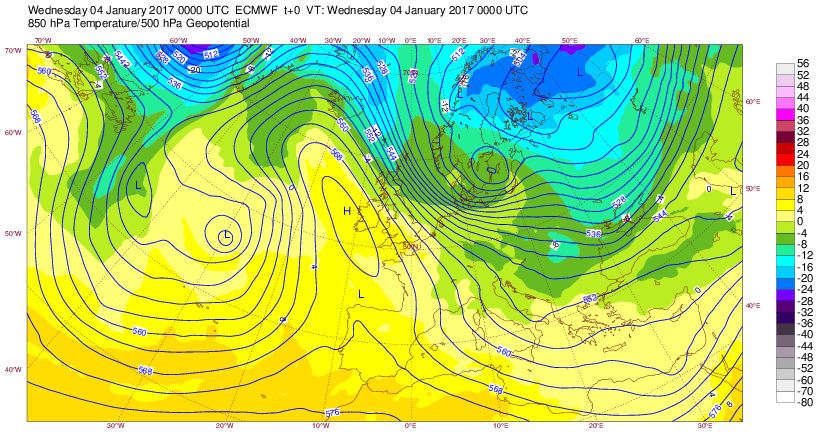
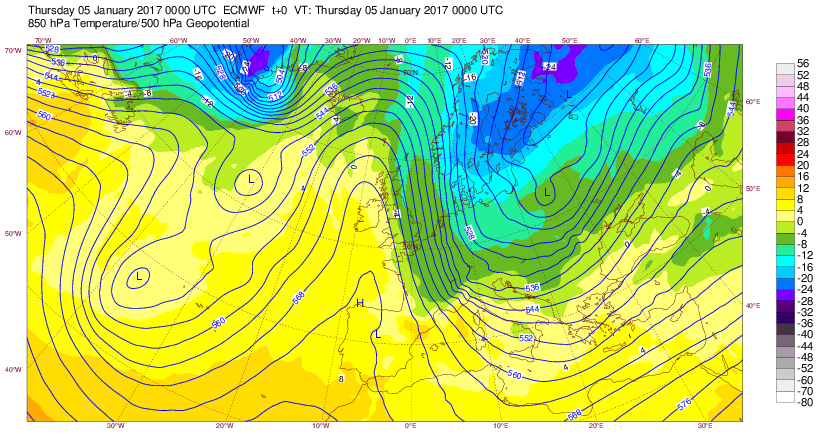
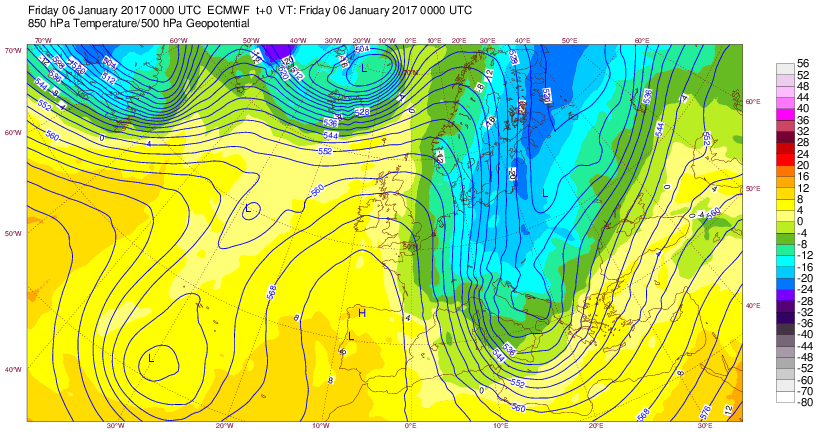
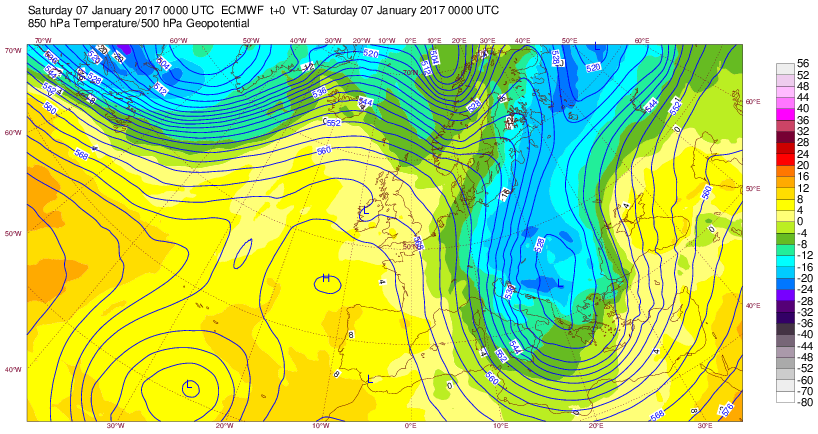
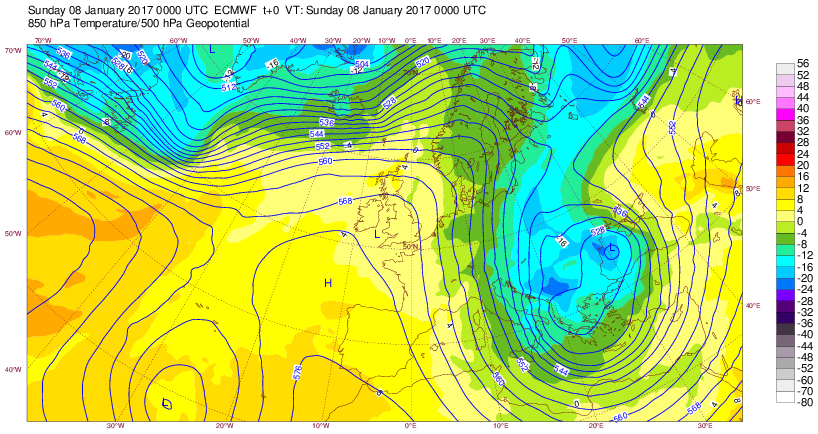
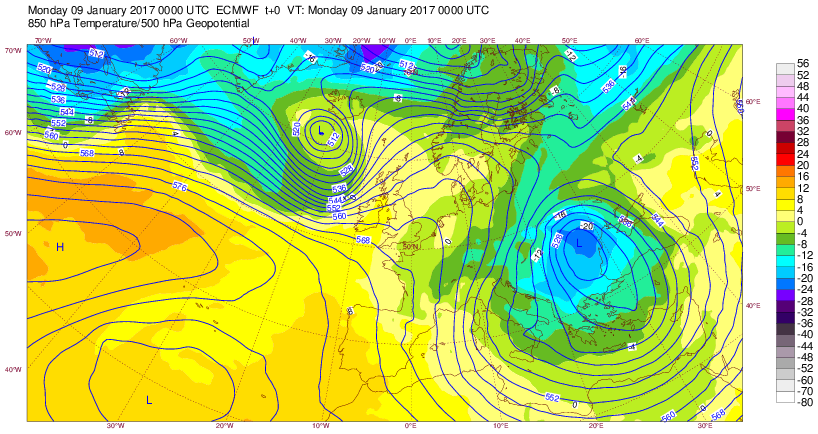
The plots below shows analyses of z500 and t850 for the period 2-9 January.

The plot above shows backward trajectories, starting on 1 January and ending on 9 January around Sofia at 850 hPa level.
The plots below show EFI and SOT for 2-metre temperature day 1 as a proxy for analysis of how extreme the temperature were from 2 to 9 January.
...
3.1 Data assimilation
3.2 HRES
The plots below show 2-metre temperature (left) and 10-metre wind speed from Sodankyla on 4 January from HRES (red) and observations (black). The model was far too warm while the wind speed was in line with observations, at least during the first part of the day.
The plot below compares the model climate from reforecasts (solid) and observation climatology (dashed).
During the cold period, heavy snowfall also hit south-eastern Europe, e.g Istanbul. The plots below show observations of precipitation on 7 and 8 January and the last forecast before each accumulation period.


3.3 ENS
The plot below show the evolution of ensemble forecasts (blue) and HRES (red dot) for 2-metre temperature in Sodankyla on 5 January 00z. The osbervation was around -40C (see above).
The plot below show the evolution of ensemble forecasts (blue) and HRES (red dot) for T850 over Trojan in central Bulgaria on 9 January 00z.
3.4 Monthly forecasts
The plots below show weekly temperature anomalies for 2-8 January.
...
4. Experience from general performance/other cases
...
5. Good and bad aspects of the forecasts for the event
...