| Section |
|---|
| Column |
|---|
| 
|
| Column |
|---|
| | Panel |
|---|
Check-list
- Create a Magics python skeleton that displays a global map using the plot command
- Create and use an output object to set-up name and format of your output
- Improve mcoast to taylor tailor the coastlines.
- Add a mtext object to add some texts.
|
|
|
...
| Section |
|---|
| Column |
|---|
| | Code Block |
|---|
| language | python |
|---|
| theme | Confluence | language |
|---|
| python | title | Python - Output |
|---|
| collapse | true |
|---|
| from Magics.macro import *
#The default plot command will create a ps called ps.ps
plot(mcoast()) |
|
| Column |
|---|
| 
|
|
...
To create a PNG output, you have to create an output object and to insert at the first position in the plot command
| Code Block |
|---|
| language | python |
|---|
| theme | Confluence | language | python |
|---|
| title | Python - Output |
|---|
| collapse | true |
|---|
|
from Magics.macro import *

#settings of the PNG output
output = output(
			output_formats = ['png'],
  			output_name = "magics",
    		output_name_first_page_number = "off"
    )

#The plot command will create a PNG output called magics.png
plot(output, mcoast()) |
...
| Section |
|---|
| Column |
|---|
| | Code Block |
|---|
| language | python |
|---|
| theme | Confluence | language | python |
|---|
| title | Python - Coastlines |
|---|
| collapse | true |
|---|
| from Magics.macro import *
#settings of the PNG output
output = output(
output_formats = ['png'],
output_name = "coast",
output_name_first_page_number = "off"
)
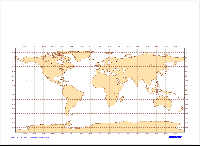
##settings of the coastlines attributes
coast = mcoast(
map_coastline_land_shade = "on",
map_coastline_land_shade_colour = "cream",
map_grid_line_style = "dash",
map_grid_colour = "brown",
map_label_colour = "brown",
map_coastline_colour = "brown"
)
#The plot command will now use the coast object
plot(output, coast) |
|
| Column |
|---|
|  |
|
...
| Section |
|---|
| Column |
|---|
| | Code Block |
|---|
| language | python |
|---|
| theme | Confluence | language | python |
|---|
| title | Python - Title |
|---|
| collapse | true |
|---|
| from Magics.macro import *
#settings of the PNG output
output = output(
output_formats = ['png'],
output_name = "coast",
output_name_first_page_number = "off"
)
##settings of the coastlines attributes
coast = mcoast(
map_coastline_land_shade = "on",
map_coastline_land_shade_colour = "cream",
map_grid_line_style = "dash",
map_grid_colour = "brown",
map_label_colour = "brown",
map_coastline_colour = "brown"
)
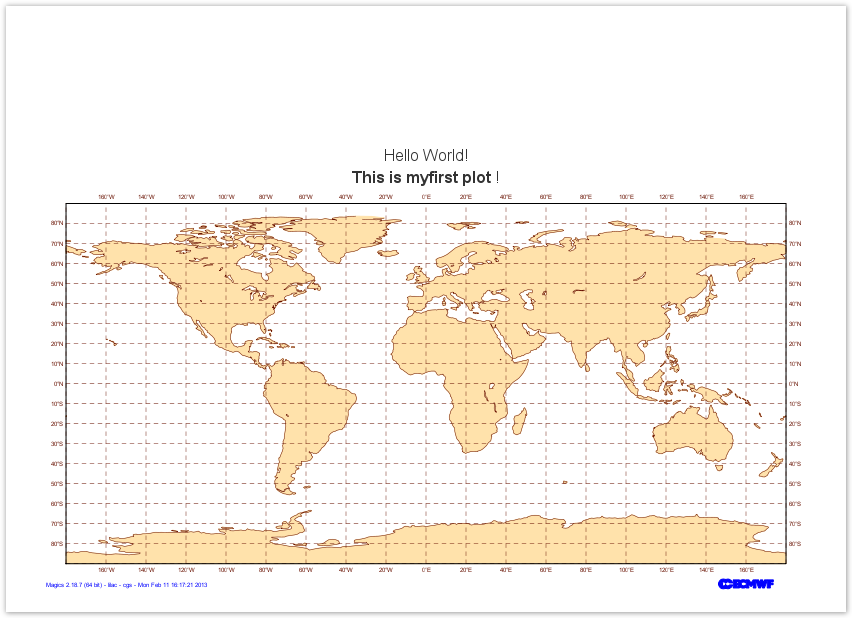
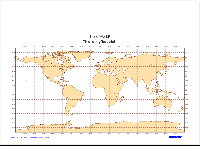
##settings of the text (notice the HTML formatting)
title = mtext(
text_lines = ["Hello World!", " <b>This is my first plot</b> !"],
text_font_size = "0.7",
text_colour = "charcoal"
)
#The plot command will now use the coast and title objects
plot(output, coast, title) |
|
| Column |
|---|
|  |
|
...