changes.mady.by.user Stephan Siemen
Saved on Mar 09, 2013
changes.mady.by.user Sylvie Lamy-Thepaut
Saved on Jan 09, 2017
Objectives of the tutorial
At the end of this tutorial, you will be able to:
load GRIB, netCDF, or simple ASCII data
The slides of the course can be found here [PDF].
Quick Links
Hello World
A Geographical Map
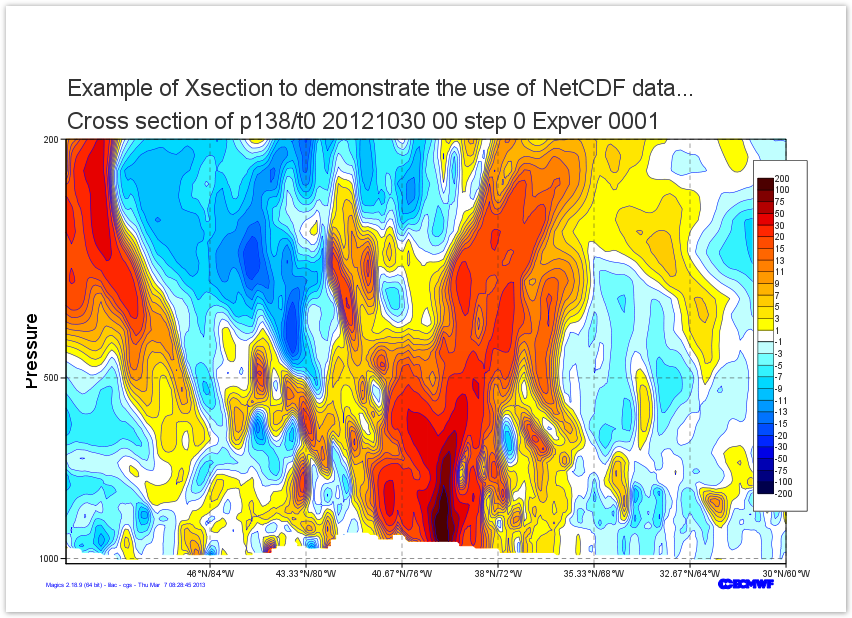
A Cross Section
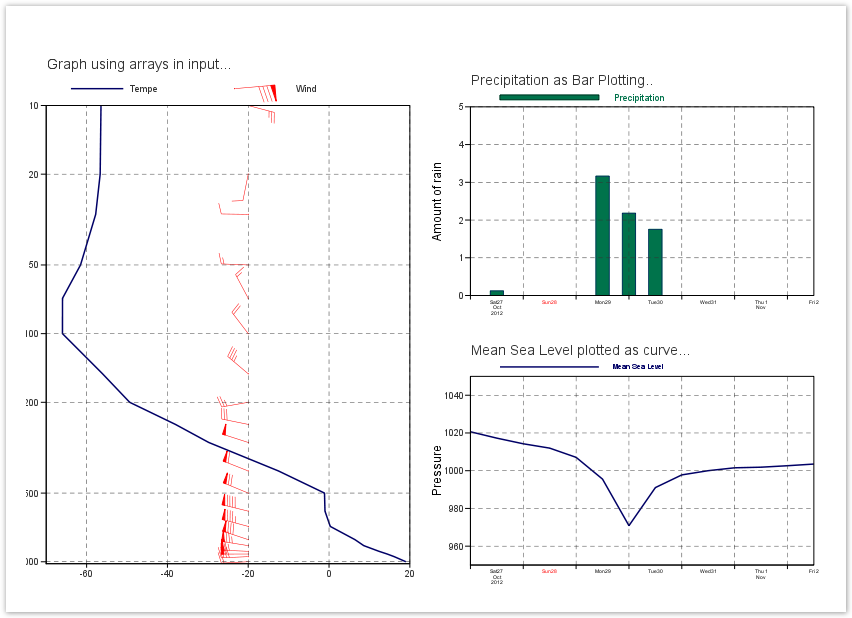
Vertical Profile and time series
More on Symbol Plotting
A Complex Layout
In short, once you have realised this plot, you will have understood and used the main concepts of Magic
...
Set-up a Cartesian projection
Learn how to
Position the legend
Go to the tutorial ...
Set-up a date coordinate system.
Go to Tutorial...