Versions Compared

Key

  • This line was added.
  • This line was removed.
  • Formatting was changed.
Warning
titleWarning

This tutorial had been designed for our next export version.. This version will be readdy for download after our training course, by the end of next week.

To use it at EMWF, please type the command

use newmagics++
 
Panel
Section
Column
width50%

Objectives of the tutorial


At the end of this tutorial, you will be able to:

  • write and run small Magics python programs.
  • create meteorological maps using different projections, or Cartesian projections
  • load GRIB, netCDF, or simple ASCII data

  • use the different action routines contour, wind, graph to visualise them
  • add text and legend
  • create a complex layout to organise your plots
  • find your way in the documentation

The slides of the course can be found here [PDF].


Quick Links


Hello World

A Geographical Map

A Cross Section

Vertical Profile and time series

More on Symbol Plotting

A Complex Layout


Column
width50%


Info

In short, once you have realised this plot, you will have understood and used the main concepts of Magic

...

Panel
titleObjectives
Section
Column
width50%
  • Set-up a Cartesian projection

  • Learn how  to

Column
width300px

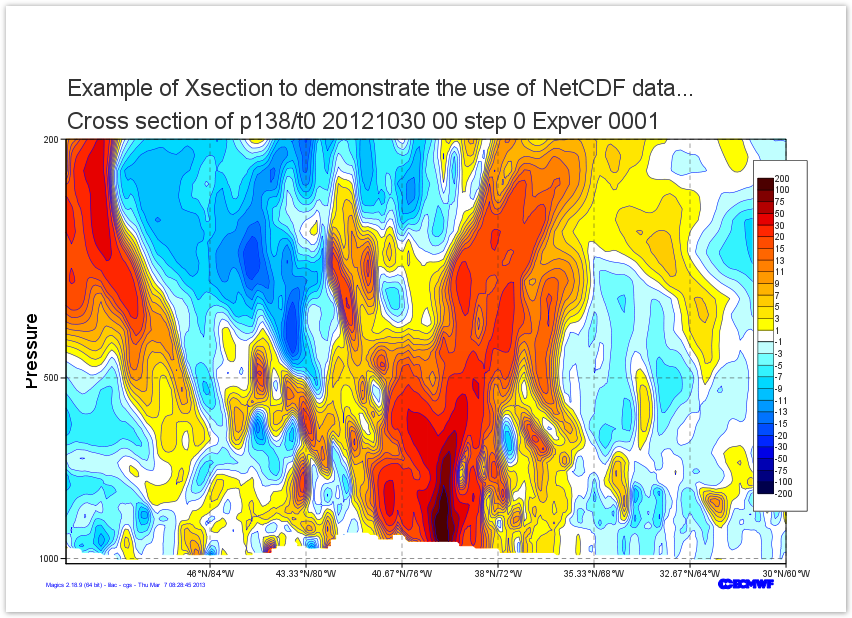
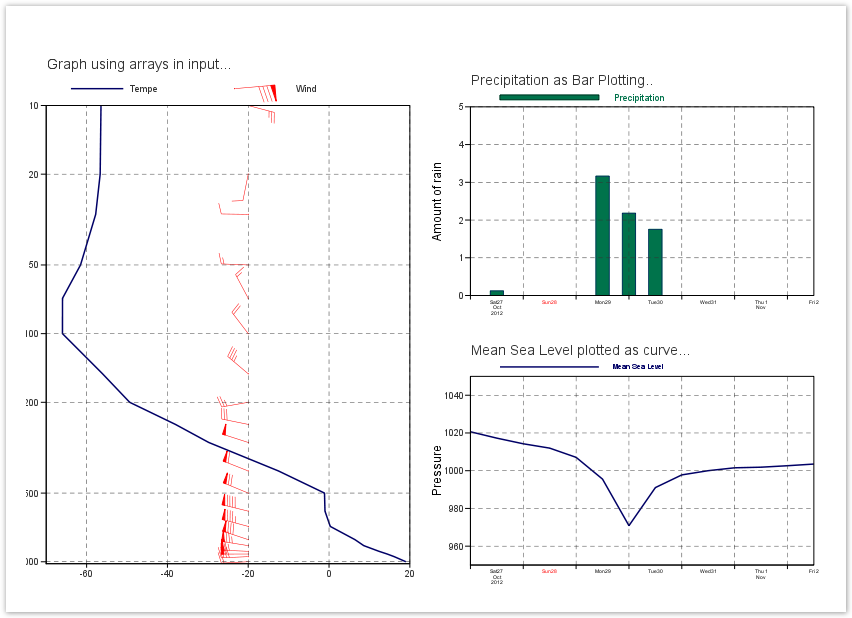
Fourth Step - a vertical profile and a Time

...

series

Panel
titleObjectives
Section
Column
width50%
  • Set-up a date coordinate system.

  • Learn how  to

    • Load a CSV file
    • Use arrays of data
    • Draw a curve or bars
  • Create a more complex layout

Go to Tutorial...

Column
width300px

...