Storm track
CSV, Polar Stereographic</font>
Boundaries, Cities and Rivers
>Cylindrical<

Difference
1

Split Contouring
>GRIB

Coloured observation values
observation
Hovmoller
Parcel method
ODB scatterplot


ENS Windgust Percentiles Example
|
 | ENS Stamp Map Example
 | ||||||||||
ENS Spaghetti Map Example
 | Streamlines Example
 | Simulated Satellite Image Example
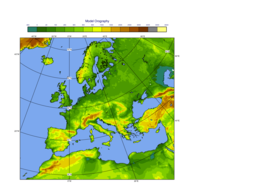
 | SST on Extended Cylindrical Map Example
 | ||||||||
ERA5 SST El Nino Maps Example
 | Histogram Legend Example
 | Disjoint Legend Example
 | Grid Values and Contour Levels Example
 | ||||||||
Temperature Below 0C Example
 |
Difference Contouring 1 Example
|
|
|
| Split Contouring |
Example
| NetCDF Temperature Example
|
 | ||||||
NetCDF Ozone Layout 2x2 Example
 | NetCDF Wind Example
 | NetCDF Sea Currents with Fix-sized Vectors |
Example
|
|
 | NetCDF Marine Observations Example
 | ||||||
Model-Obs Difference Example
 | BUFR Synop Example
 | BUFR Synop Station Id Example
|
 | BUFR Temp Example
 | ||||||||||
Coloured Observation Values Example
 | Coloured Observation Values in Circles Example
 | ODB Radiance Map Example
 | ODB Temp Wind Example
 | ||||||||
| Aircraft |
Observations Example
 | Text at Geopoints Locations Example
 | Coastlines Resolutions Example
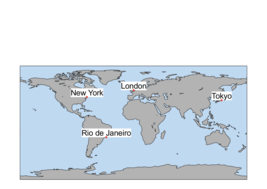
 | Capital Cities Example
 | ||||||||
Boundaries, Cities and Rivers Example
| Custom Shapefile Map Layer with Major River Basins Example
 | Geoline on Map Example
 | Geopolyline on Map Example
 | ||||||||
Geocircle on Map Example
 | Storm Track Example
| Storm Wind Quadrants Example
 | FLEXTRA Forward Trajectories Example
 | ||||||||
Wind Vectors from Lists Example
 | Cross Section Example
 | Cross Section in Pressure with Orography Example
 | Cross Section in Pressure with Orography and Boundary Layer Height Example
 | ||||||||
Cross Section in Height for Model Level Data with Orography Example
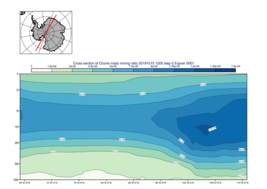
 | Cross Section Going Through the South Pole Example
 | Cross Section Normal Wind Component with Map Example
 | Cross Section Parallel Wind Component with Map Example
 | ||||||||
Cross Section 3D Parallel Wind Component Example
 | Zonal Average Example
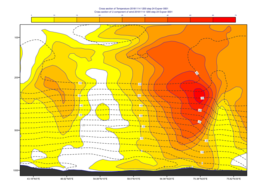
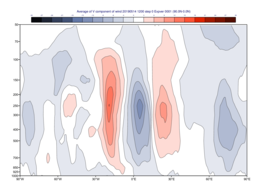
 | Temporal Zonal Average of ERA5 V Wind Component Example
 | Zonal Average Difference Example
 | ||||||||
Meridional Average Example
 | Hovmoeller Area Average Example
|
 | ERA5 Ozone Latitude Hovmoeller Example
 | ERA5 Quasi Biennial Oscillation on Vertical Hovmoeller Example
 | |||||||||
Time-height Section Example
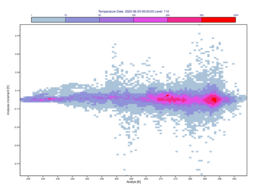
 | GRIB Scatterplot Example
 | Tephigram from Lists Example
 | Tephigram from BUFR Example
 |
Tephigram from ODB Example
 | Parcel Method on Skew-T Example
 | ENS Tephigram Example
 | Hodograph from BUFR Example
 | ||||||||
Time Series from GRIB Example
 | Time Series Curves From Lists Example
 | Fill Area Between Curves Example
|
 | Curve With Log Y Axis Example
 | ||||||||||
CDF Curve Example
 | ODB Scatterplot Example
 | ODB Wind Profiler Example
 | Bar Plotting Example
 | ||||||||
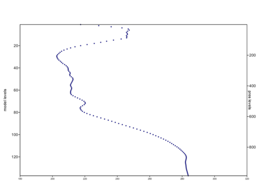
Profile Plot with Double Axis Example
 | Curves with Different Y Scales Example
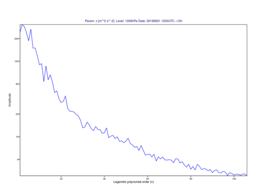
 | Spherical Harmonics Spectrum Example
 | Taylor diagram Example
 |