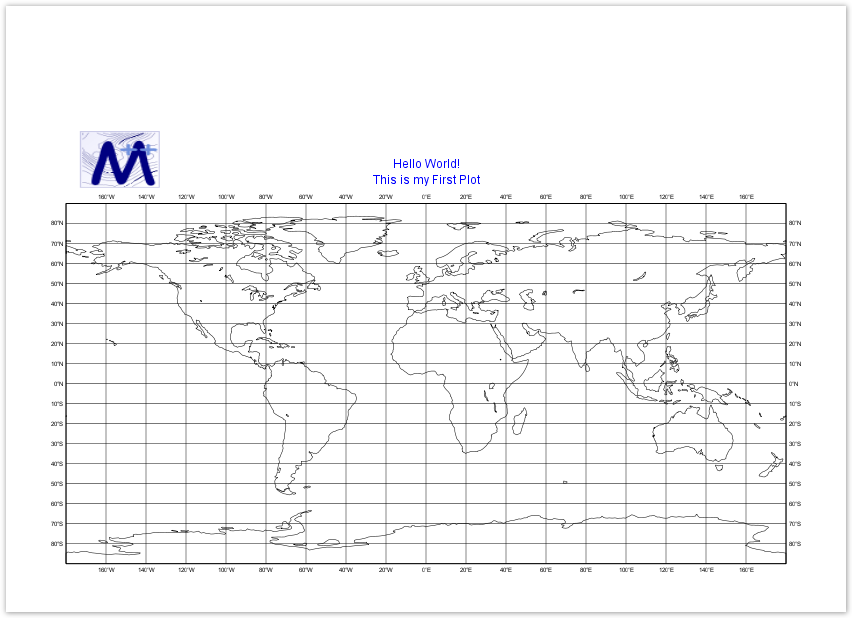
- Create a Magics python skeleton that displays a global map using the plot command
- Create and use an output object to set-up name and format of your output
- Improve mcoast to taylor the coastlines.
- Add a mtext object to add some texts.
Step by step
In order to be able to create and use Magics objects, the Magics python package has to be imported.
from Magics.macro import *
Any Magics plots will be triggered using the plot command, the simplest plot example is :
plot(mcoast())
The result will be a geographical map, using the default projection, and the default attributes of coastlines.
Magics will instantiate the default driver.
Create a postscript file called ps.ps, mcoast() create a default coastlines object.
Setting the output
The object output allows the definition of the output format, and the settings of the output file name .
Have a look at the PNG output documentation to see which parameters are available to set-up a PNG output.
To create a PNG output Magics, you have to create an output object and to insert at the first position in the plot command