You are viewing an old version of this page. View the current version.
Compare with Current
View Page History
« Previous
Version 3
Next »
The Climate Data Store (CDS) Toolbox is the path to a wealth of past and future climate information. Free and available to everyone, the Toolbox links raw data to online computing power through a programming interface. In your own online workspace you can create applications in Python (a programming language) and run them on the CDS computers, allowing you to retrieve the data you are interested in, make the calculations you require and display the results in the format that suits your needs. You can download graphs, maps and data, and also share your online creations with other users.
The Toolbox is aimed at a wide range of users, from amateur climate enthusiasts through to students, researchers and software developers. To make use of the Toolbox, you will need a basic working knowledge of Python and access to the internet. You will not need a particularly powerful computer or a lot of storage, as the calculations and the data processing take place online within the CDS.
The CDS Toolbox service is accessible here.
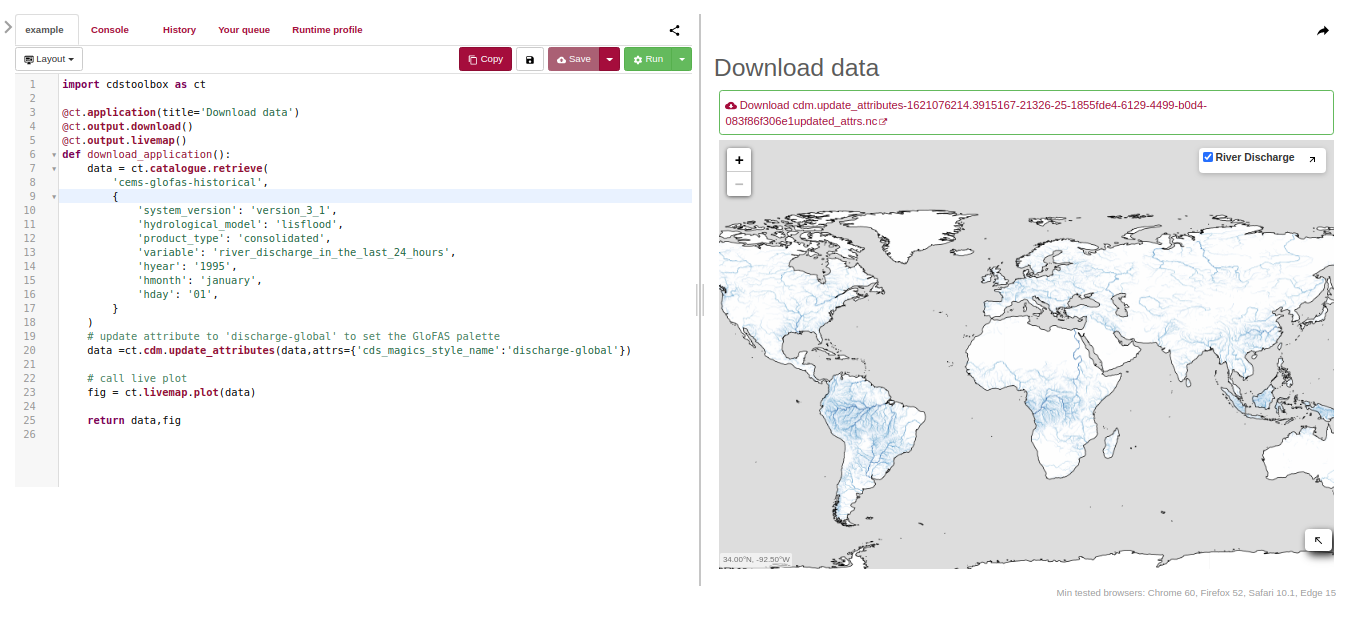
import cdstoolbox as ct

@ct.application(title='Download data')
@ct.output.download()
@ct.output.livemap()
def download_application():
    data = ct.catalogue.retrieve(
        'cems-glofas-historical',
        {
            'system_version': 'version_3_1',
            'hydrological_model': 'lisflood',
            'product_type': 'consolidated',
            'variable': 'river_discharge_in_the_last_24_hours',
            'hyear': '1995',
            'hmonth': 'january',
            'hday': '01',
        }
    )
    # update attribute to 'discharge-global' to set the GloFAS palette
    data =ct.cdm.update_attributes(data,attrs={'cds_magics_style_name':'discharge-global'})

    # call live plot
    fig = ct.livemap.plot(data)

    return data,fig
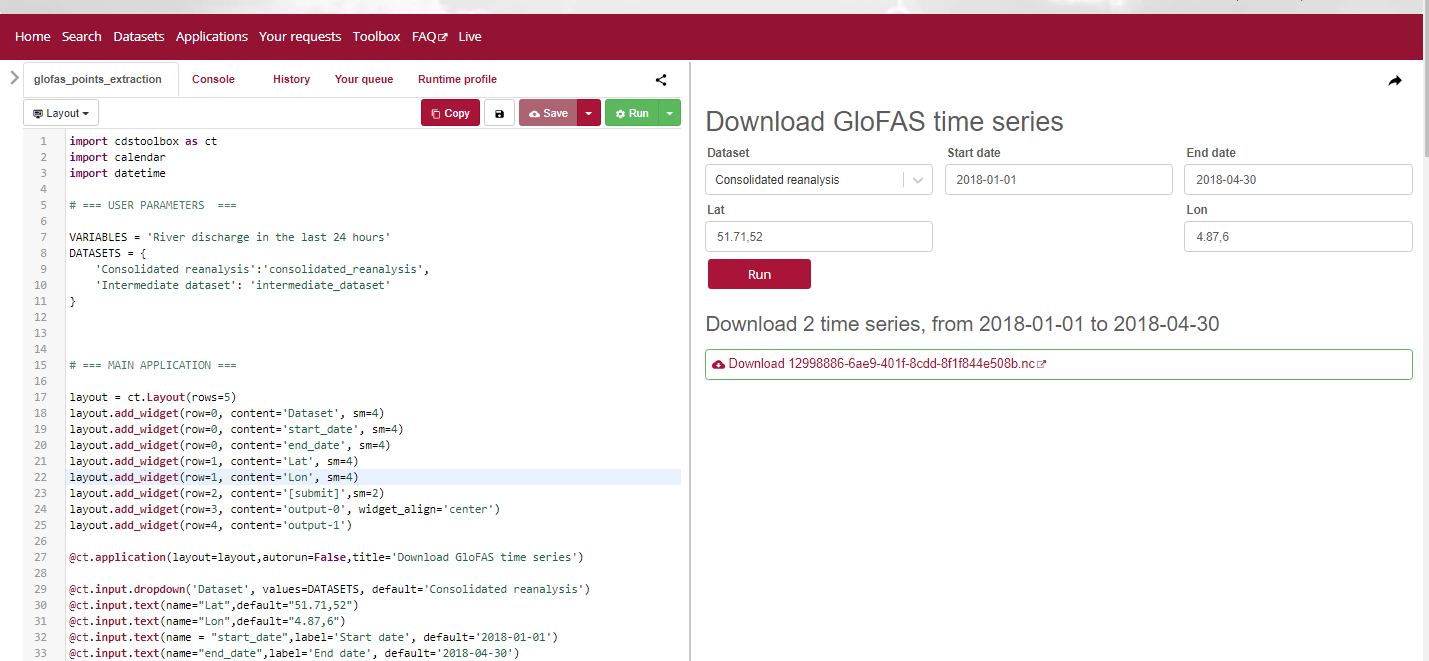
import cdstoolbox as ct
import calendar
import datetime

# === USER PARAMETERS  ===

VARIABLES = 'River discharge in the last 24 hours'
DATASETS = {
    'Consolidated reanalysis':'consolidated_reanalysis',
    'Intermediate dataset': 'intermediate_dataset'
}


# === MAIN APPLICATION ===

layout = ct.Layout(rows=4)
layout.add_widget(row=0, content='Dataset', sm=4)
layout.add_widget(row=0, content='start_date', sm=4)
layout.add_widget(row=0, content='end_date', sm=4)
layout.add_widget(row=1, content='Lat', sm=4)
layout.add_widget(row=1, content='Lon', sm=4)
layout.add_widget(row=2, content='[submit]',sm=2)
layout.add_widget(row=3, content='output-0', widget_align='center')
layout.add_widget(row=3, content='output-1', widget_align='center')

@ct.application(layout=layout,autorun=False)

@ct.input.dropdown('Dataset', values=DATASETS, default='Consolidated reanalysis')
@ct.input.text(name="Lat",default="51.71,52")
@ct.input.text(name="Lon",default="4.87,6")
@ct.input.text(name = "start_date",label='Start date', default='2018-01-01')
@ct.input.text(name="end_date",label='End date', default='2018-04-30')

@ct.output.markdown()
@ct.output.download()
def viewer_application(Dataset= None,
                       Lat=None,
                       Lon=None,
                       start_date=None,
                       end_date=None):


    dates = compute_dates_range(start_date,end_date)


    data = []

    for date in dates:


        _,n_days = calendar.monthrange(date.year,date.month)

        request =             {
            'system_version': 'version_2_1',
            'variable': 'river_discharge_in_the_last_24_hours',
            'hyear': date.strftime("%Y"),
            'hmonth': date.strftime("%m"),
            'hday': list(map(lambda x: '%02d'%(x) ,range(1,n_days+1))),
            'dataset': DATASETS[Dataset],
        }


        temp = ct.catalogue.retrieve('cems-glofas-historical', request)


        data.append(temp)


    data = ct.cube.concat(data,dim="forecast_reference_time")

    data =ct.cdm.update_attributes(data,attrs={'cds_magics_style_name':'discharge-global'})

    lat,lon= list(map(float,Lat.split(","))),list(map(float,Lon.split(",")))


    if len(lat)> 1:
        point = [ct.shapes.point(lat=y,lon=x,label= f'Lon: {x}\n Lat: {y}') for x,y in zip(lon,lat)]
    else:
        point = [ct.shapes.point(lat=lat, lon=lon, label= f'Lon: {lon}\n Lat: {lat}')]

    ts = []

    for x,y in zip(lon,lat):


        ts.append(ct.geo.extract_point(data,lon=x, lat=y))

    if len(ts) >1:

        ret =  ct.cube.concat(ts, dim='station')

    else:
        ret = ts[0]


    text = f"#Download {len(lat)} time series, from {start_date} to {end_date}"


    return text,ret


# === FUNCTIONS ====

def compute_dates_range(start_date,end_date):
    start_date = datetime.date(*[int(x) for x in start_date.split('-')])

    end_date = datetime.date(*[int(x) for x in end_date.split('-')])

    end_date = end_date + datetime.timedelta(1)

    date_range =  end_date - start_date

    dates = []
    for d in range(date_range.days):
        dates.append(start_date + datetime.timedelta(d))

    dates = [i for i in dates if i.day == 1]
    return dates