Contributors: Ole Einar Tveito (MET Norway) and Cristian Lussana (MET Norway)
Issued by: Ole Einar Tveito (MET Norway) and Cristian Lussana (MET Norway)
Issued Date: 31/03/2024
Ref: M311_Lot3.3.1.2_NGCD_PUG_ver5
Official reference number service contract: C3S2 311 Lot3
History of modifications
List of datasets covered by this document
Related documents
| Reference ID | Document |
|---|---|
D1 | NGCD Algorithm Theoretical Basis Document |
D2 | Climate and Forecast (CF) Conventions and Metadata; http://cfconventions.org |
D3 | R Core Team (2017). R: A language and environment for statistical computing. R Foundation for Statistical Computing, Vienna, Austria. URL https://www.R-project.org/ |
Acronyms
Acronym | Definition |
CDS | |
MET Norway | |
FMI | |
KNMI | |
SMHI | |
NGCD | Nordic Gridded Climate Dataset (DOI:https://doi.org/10.24381/cds.e8f4a10c |
NGCD-1 | NGCD type 1 datasets |
NGCD-2 | NGCD type 2 datasets |
seNorge | Observational gridded dataset over Norway (senorge.no) |
ECA&D | |
TITAN | |
OI | Optimal Interpolation |
| RMSE | Root Mean Squared Error |
Main variables
Symbol | Definition |
TG | Daily mean temperature (from day before the date in the timestamp at 06 UTC, to date in the timestamp at 06 UTC) |
TX | Daily maximum temperature (from day before the date in the timestamp at 18 UTC, to date in the timestamp at 18 UTC) |
TN | Daily minimum temperature (from day before the date in the timestamp at 18 UTC, to date in the timestamp at 18 UTC) |
RR | Daily precipitation total (from day before the date in the timestamp at 06 UTC, to date in the timestamp at 06 UTC) |
Data access information
| Description | Link |
|---|---|
The historical archive for different versions is made available to users via the CDS | https://cds.climate.copernicus.eu/cdsapp#!/dataset/insitu-gridded-observations-nordic |
| The data are also available to users via MET Norway OPeNDAP access | https://thredds.met.no/thredds/catalog/ngcd/catalog.html |
| MET Norway. Historical archive ver. 24.03 (for different versions, replace 24.03 with the correct label) | https://thredds.met.no/thredds/catalog/ngcd/version_24.03/catalog.html |
| MET Norway. Provisional archive | https://thredds.met.no/thredds/catalog/ngcd/provisional/catalog.html |
The list of Known issues is available at the following link.
Scope of the document
This document is the user guide for the NGCD observational gridded dataset produced under the service contract C3S2_311 Lot3 (Collection and processing of in situ observations - Access to high-resolution gridded datasets over Europe based on in situ observations) on behalf of Copernicus.
The primary objective of this guide is to assist users in comprehending both the features and potential limitations of the dataset. Furthermore, it aims to provide clear instructions on how to access, read, and effectively utilize the data.
Executive summary
The NGCD is an observational gridded dataset that covers Fennoscandia, encompassing Finland, Norway, and Sweden. It exclusively relies on in-situ observations. The dataset includes the following main variables: daily mean temperature (TG); daily maximum temperature (TX); daily minimum temperature (TN); daily total precipitation (RR).
NGCD comprises two independent datasets: NGCD-1 and NGCD-2. Both are derived by employing different spatial interpolation techniques on the same observational dataset. Comprehensive details about the input data and the methodologies can be found in the NGCD Algorithm Theoretical Basis Document (D1).. NGCD's programs utilize the R programming language D3, and the algorithms and scripts can be accessed at github.com/metno/NGCD.
The data products are structured on a regular grid, defined by the Lambert Azimuthal Equal Area coordinate reference system. The grid spacing is 1 km in both Easting and Northing directions. For each day, eight fields are available: four from NGCD-1 methods (one for each variable) and four from NGCD-2 methods. Each of these fields is stored in a distinct file, and all the data files adopt the netCDF-4 format.
The NGCD undergoes full updates biannually, specifically in March and September. Following each update, a new version is released, labeled as Year.Month (for instance, the March 2024 update is designated as ver. 24.03). Semi-annual datasets released through the CDS will be publicly accessible for up to three years post-release. The latest version of this document pertains to NGCD ver. 24.03.
Every version consists of two distinct archives: i) the historical archive and ii) the provisional archive (provisional data for a particular version are deleted when superseded by a subsequent historical archive).
For ver. 24.03:
The historical archive encompasses the period from January 1961 to December 2023. Any post-production modifications to the historical archive are documented in the "List of Known issues" and/or within the "Known Issues" section on the NGCD page on the MET Norway thredds server.
The provisional archive is exclusive to NGCD-2 files. It starts from 1st January 2024 and is updated daily. This means that some files, typically the most recent ones, can vary daily without specific notice. The methodologies employed for the provisional products mirror those used for the NGCD-2 historical archive. However, the observation data used as input is sourced from the open data application programming interfaces of FMI, MET Norway, and SMHI. The provisional data from January to June 2024 will be superseded by the historical archive in the subsequent NGCD version.
For data access, please refer to the provided links in the "Data access information" section. A comprehensive description of NGCD is presented in the "Product information" section. Additionally, Appendix A details the evaluation for ver. 18.03, which is consistent with the methodologies employed for all versions up to ver. 24.03. Lastly, Appendix B showcases examples of file structures.
1. Product information
1.1. Product description
The description of the input data and the methods is available in the NGCD Algorithm Theoretical Basis Document [D1]. As specified in D1, the user must be aware that the NGCD input data are non-homogenized time series.
The time series illustrating the number of stations used to produce NGCD version 24.03 are depicted in Figures 1-4, corresponding to RR, TG, TN and TX respectively. The number of RR stations in the region has decreased from approximately 2400 stations-per-day in 1980 to 1400 stations-per-day in 2020, marking a decline of about 42%. This number has further decreased by 2023. Conversely, for TG, the number of stations has been on the rise after 2010, growing from 800 stations-per-day in 2000 to slightly over 1300 stations-per-day in 2020, an increase of roughly 62%. This surge is primarily attributed to the integration of sub-regional networks in Norway, overseen by Norwegian public institutions. It's worth noting that the number of stations used for TG production after 2010 exhibits greater daily fluctuations compared to previous years. As for TX and TN, there's a steady decline in station numbers from 1971 to 1994. However, there's a resurgence and gradual increase from 1995 onwards. Between 1971 and 2020, the relative changes for TX and TN are less pronounced than for TG, with station numbers ranging from a low of about 700 to a high of 1000 stations-per-day, reflecting an increase of around 43%.
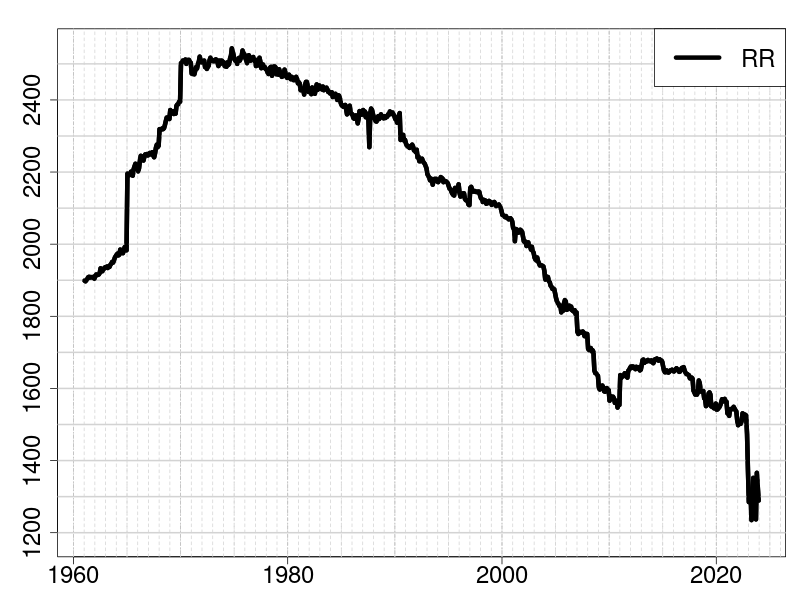
Figure 1: Daily precipitation total (RR): monthly time series of the number of stations used in the production of NGCD ver 24.03 from January 1961 to December 2023. For each month, the number of stations shown is the median of the stations available daily.

Figure 2: Daily mean temperature (TG): monthly time series of the number of stations used in the production of NGCD ver 24.03 from January 1961 to December 2023. For each month, the number of stations shown is the median of the stations available daily.

Figure 3: Daily minimum temperature (TN): monthly time series of the number of stations used in the production of NGCD ver 24.03 from January 1961 to December 2023. For each month, the number of stations shown is the median of the stations available daily.

Figure 4: Daily maximum temperature (TX): monthly time series of the number of stations used in the production of NGCD ver 24.03 from January 1961 to December 2023. For each month, the number of stations shown is the median of the stations available daily.
Figures 5-7 illustrate the spatial distribution of observation stations across the domain for the variables RR, TG, and TN respectively. Since the distribution pattern for TX closely mirrors that of TN, it isn't separately depicted. For RR and TG, the two panels in the top row present scenarios where the number of stations is near the period's minimum, indicative of a "sparse" observational network. Conversely, the two panels on the bottom row depict situations with the maximum station count. In the case of TN, Figure 7 contrasts the distributions in 2020 ("sparse" network) and 2021 ("dense" network).
A closer examination of the figures reveals: left column panels provide maps showcasing station distributions throughout the domain; right column panels focus on observational coverage concerning elevation.
Upon assessing RR, a discernible decline in station count over time becomes evident. This decline notably affects the map's representation and, more strikingly, highlights elevation areas not sufficiently covered by the observational network. Specifically, in the northern regions, the network does not cover more than half of the higher elevation range.
In the context of TG, there's a concentration of the increase in station numbers over Norway, leading to a more consistent sampling across various elevations than seen with RR.
Regarding TN (and by implication, TX), the pattern echoes that of TG. However, a key distinction arises: until 2021, the observational network over Norway is relatively sparse. From 2021 onwards, a consistent observational network emerges for all temperature-related variables.

Figure 5: Daily precipitation total (RR): spatial distribution of the observing stations used in the production of NGCD when the observational network consists of a smaller number of stations (“sparse” observational network, top row) and a larger number of stations (“dense” observational network, bottom row) with respect to the the time series of available observations (see Figure 1). The left column shows maps over the domain while the right column shows the elevations of the stations (blue dots) as a function of their Northing coordinates. As a reference in the background, the gray dots are the elevations of the cells on the 1 km digital elevation model over Fennoscandia

Figure 6: Daily mean temperature (TG): spatial distribution of the observing stations used in the production of NGCD when the observational network consists of a smaller number of stations (“sparse” observational network, top row) and a larger number of stations (“dense” observational network, bottom row) with respect to the the time series of available observations (see Figure 2). The left column shows maps over the domain while the right column shows the elevations of the stations (red dots) as a function of their Northing coordinates. As a reference in the background, the gray dots are the elevations of the cells on the 1 km digital elevation model over Fennoscandia.

Figure 7: Daily minimum temperature (TN): spatial distribution of the observing stations used in the production of NGCD when the observational network consists of a smaller number of stations (“sparse” observational network, top row) and a larger number of stations (“dense” observational network, bottom row) with respect to the the time series of available observations (see Figure 3). The left column shows maps over the domain while the right column shows the elevations of the stations (green dots) as a function of their Northing coordinates. As a reference in the background, the gray dots are the elevations of the cells on the 1 km digital elevation model over Fennoscandia.
1.2. Data usage information
1.2.1. File naming convention
The data files are in netCDF-4 format and follow the CF-standards, see D2 in Section Related Documents.
For the historical archive, the file names have the format:
NGCD_<Var>_type<Id_type>_version_<ver>_<Date>.nc
Where:
- <Var> is one of: RR, TG, TX and TN
- <Id_type> is either 1 or 2
- <ver> is the version label in the format Year.Month (e.g. 24.03)
- <Date> is in the form YYYYMMDD
For the provisional archive, the file names have the format:
NGCD_<Var>_type2_version_<ver>_prov_<Date>.nc
Where the meaning of the variable components within the symbols <...> mirrors that of the historical archive, it's noteworthy to highlight:
i) Only NGCD-2 is provided in the provisional archive.
ii) While there's a mention of a version, signaling the methodology deployed in data production, the source of these observations diverges from the historical archive of the corresponding version.
1.2.2. Data format
The key fields provided in this product are as given in Table 1.
Table 1: Key data fields in the output files.
Variable Name | Description |
lon | longitudes of the grid points |
lat | latitudes of the grid points |
projection_laea | specification of the coordinate reference system |
time_bounds | time bounds of the aggregated variable |
TG / TX / TN / RR | daily variable in the file |
The provided data is single-layered, situated near the surface, and gridded on a regular grid covering Finland, Norway, and Sweden. Excluding a narrow buffer that extends a few kilometers into the sea, the grid is masked in regions beyond this domain and over the ocean due to the absence of in-situ observations. Utilizing the Lambert Azimuthal Equal Area projection as its coordinate reference system, the grid spacing is of 1 km in both the Easting and Northing directions. Specifically, its dimensions span 1550 units in Easting and 2020 in Northing. Figures 5-7 graphically represent this spatial domain.
On accessing files from the CDS, users receive individual files tailored to each specific day, variable, and requested NGCD-type. Notably, these fields carry a time dimension, which consistently measures a length of one.
1.2.3. Product content examples
Figures 8-10 provide illustrations of NGCD products for two distinct days.
Figure 8 displays the RR fields for 10 January 2021. NGCD-1, which utilizes triangulation, incorporates local adjustments for precipitation in mountainous areas based on elevation. In contrast, NGCD-2 offers a more seamless precipitation field compared to NGCD-1, as it doesn't make elevation adjustments, leading to generally smoother RR fields. Regardless of type, in regions sparse with data, values echo broader-scale precipitation. In contrast, data-rich regions typically showcase a higher variability in the reconstructed field.

Figure 8: Daily precipitation totals (RR, mm) for 10 January 2021: NGCD-1 on the left; NGCD-2 on the right.
Figures 9 and 10 respectively depict the TG and TN, TX for a day in spring, specifically 30 May 2021.

Figure 9: Daily mean temperature (TG, oC) for 30 May 2021: NGCD-1 on the left; NGCD-2 on the right.


Figure 10: Daily minimum and maximum temperatures (TN top row, TX bottom row, oC) for 30 May 2021: NGCD-1 in the left column; NGCD-2 in the right column.
1.3. Data usage acknowledgments
All users of NGCD must provide clear and visible attribution to the Copernicus programme and are asked to cite and reference the dataset provider. Acknowledge according to the licence to use Copernicus Products.
Cite NGCD as indicated on the link to "Citation" under References on the Overview page of NGCD.
MET Norway data
The Norwegian data is freely available from MET Norway via frost.met.no.
We acknowledge the data providers in the ECA&D project. Klein Tank, A.M.G. and Coauthors, 2002. Daily dataset of 20th-century surface air temperature and precipitation series for the European Climate Assessment. Int. J. of Climatol., 22, 1441-1453. Data and metadata available at https://www.ecad.eu
Appendix A - Evaluation of version 18.03
The evaluations presented in this Appendix for Temperature and Precipitation are based on NGCD version 18.03 and the data used covers the 46-year period from 1971 to 2016.
Temperature
The strategy used for evaluation is cross-validation by means of a leave-one-out procedure. In this way, NGCD is evaluated against independent observations, which are used as reference values. NGCD values are interpolated to the observation locations using a bilinear interpolation. The score considered in the evaluation is the root mean square error (RMSE) based on the deviations between estimated and reference values.
In Figures A1-A3, the RMSE for the daily minimum temperature (TN) is used to compare the two NGCD types. In Figure A1, the results have been aggregated over space and time to show the mean seasonal cycle. In Figures A2-A3, the results are aggregated over time at each observation location, such that the spatial patterns are highlighted.
Figure A1 shows that NGCD-2 has the lowest RMSE, in particular during the cold season when small scale spatial variability of the temperature fields is higher than for the rest of the year (e.g. temperature inversions occur more often during winter). The differences among the two types are smaller during the summer months.
Figure A2 shows the RMSE spatial variability in January, while Figure A3 shows the same quantity for August. In January, both NGCD-types have the smallest RMSE values over the flat regions in Southern Sweden and Finland. Furthermore, RMSE is low along the coasts. The RMSE is larger in the mountainous regions. NGCD-2 shows smaller RMSE than NGCD-1 in these regions. In August (Figure A3), the RMSE values are smaller than during winter. For NGCD-1, there are a few stations that have a rather high RMSE. The results for NGCD-2 show less variability and there are fewer stations with large RMSE. For both types, the stations with the largest RMSEs are spatially scattered indicating that their locations and observed minimum temperatures are influenced by local effects, which are not reflected in the regional minimum temperature signal.

Figure A1: Daily minimum temperature (TN): boxplots of the mean seasonal cycle, for the 46-year period from 1971 to 2016, of mean RMSE (oC) based on leave-one-out cross-validation for NGCD-1 (black boxes) and NGCD-2 (red boxes).

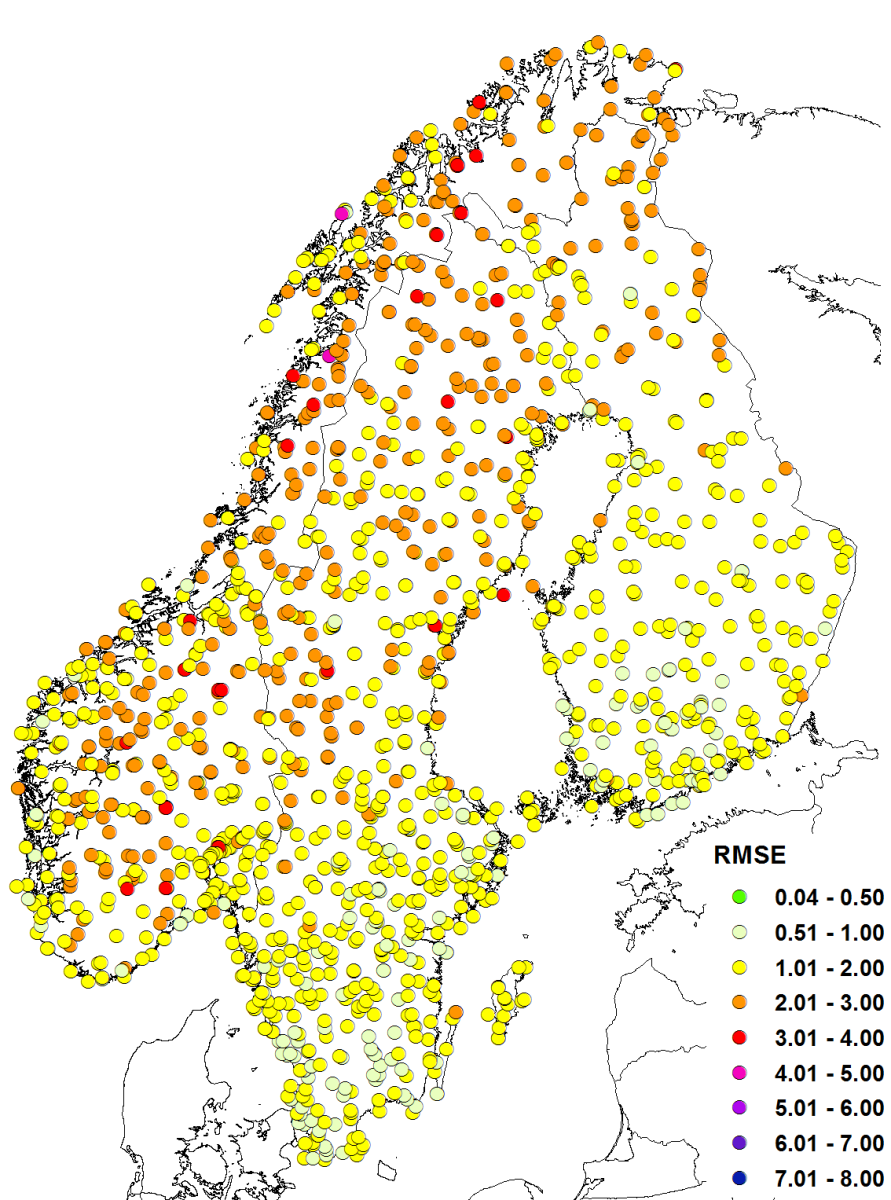
Figure A2: Daily minimum temperature (TN): RMSE (oC) station-by-station averaged over all January months for the 46-year period from 1971 to 2016: NGCD-1 (left) and NGCD-2 (right).


Figure A3: Daily minimum temperature (TN): RMSE (oC), same as FigureA2 but for the month of August.
The analysis of the RMSE for daily maximum temperature (TX) is shown in Figures A4-A6. In Figure A4, the seasonal variations of the RMSE for TX show a different pattern than for TN (see Figure A1). In the case of TX, the RMSE is higher in summer than during spring or autumn. NGCD-2 shows smaller RMSE values than NGCD-1 in all months. For NGCD-1, RMSE is highest in winter. For NGCD-2, the RMSE medians have comparable values during winter and summer, though the corresponding inter-quartile ranges (i.e. the box widths) are larger in winter.
The spatial variations of RMSE for TX are shown in Figures A5-A6 and they show a similar pattern as for TN in Figures A2-A3. The largest RMSEs occur in the inland and/or mountain regions of Norway, Sweden and Finland. In these regions the RMSE variability is also greater than elsewhere. The flat regions in southern Sweden and Finland have low RMSE values. Overall, NGCD-2 shows lower RMSEs than NGCD-1 both in winter (Figure A5) and in spring (Figure A6).

Figure A4: Daily maximum temperature (TX): boxplots of the mean seasonal cycle, for the 46-year period from 1971 to 2016, of mean RMSE (oC) based on leave-one-out cross-validation for NGCD-1 (black boxes) and NGCD-2 (red boxes).


Figure A5: Daily maximum temperature (TX): RMSE (oC) station-by-station averaged over all January months for the 46-year period from 1971 to 2016: NGCD-1 (left) and NGCD-2 (right).


Figure A6: Daily maximum temperature (TX): RMSE (oC), same as FigureA5 but for the month of April.
In Figures A7-A9, the RMSE comparison is performed for the daily mean temperature (TG), similarly to that above for TN and TX.
The results we found for TG are quite similar to those for TN and TX. In Figure A7, RMSE shows the same strong seasonal cycle we found for TN in Figure A1, though for TG the RMSE values are smaller than for TN. NGCD-2 is generally performing better (i.e. with a smaller RMSE) than NGCD-1. The spatial variability reveals the same patterns as for TN and TX. In Figure A8, it is shown that during winter, in continental and mountainous parts of the domain, the RMSE is high and there are large spatial variations over small distances. On the other hand, Figure A9 shows that in late summer the RMSE is characterized by low values and small spatial variations. Once again, NGCD-2 is generally performing better (i.e. with a smaller RMSE) than NGCD-1.

Figure A7: Daily mean temperature (TG): boxplots of the mean seasonal cycle, for the 46-year period from 1971 to 2016, of mean RMSE (oC) based on leave-one-out cross-validation for NGCD-1 (black boxes) and NGCD-2 (red boxes).


Figure A8: Daily mean temperature (TG): RMSE (oC) station-by-station averaged over all January months for the 46-year period from 1971 to 2016: NGCD-1 (left) and NGCD-2 (right).
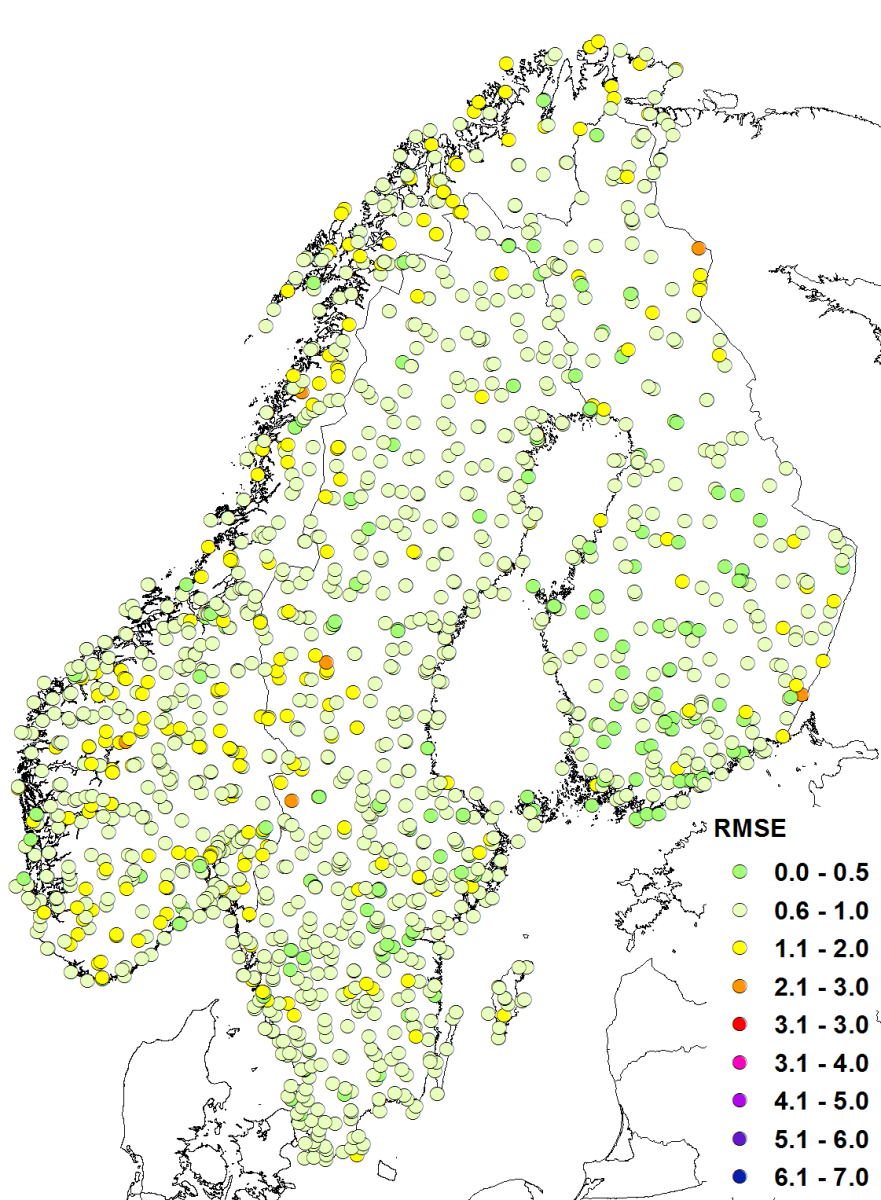

Figure A9: Daily mean temperature (TG): RMSE (oC), same as Figure A8 but for August.
Precipitation
For precipitation the cross-validation study is carried out on a selection of 50 stations (Figure A10), which have not been used in the production of NGCD. This cross-validation approach differs from the one used for temperature because all 50 stations are reserved for evaluation simultaneously and not one at a time, as in leave-one-out cross-validation. The estimates are compared with the independent observations by means of standard verification scores like probability of detection (POD), false alarm rate (FAR, also known as probability of false detection or POFD), equitable threat score (ETS) and bias score. We refer to the page of the 7th International Verification Methods Workshop for the score definitions.
The POD, FAR, ETS and bias score are dimensionless quantities. They are used for the evaluation of dichotomous (yes/no) predictions, therefore they have been applied to events like "precipitation is higher than X mm", where X is the daily precipitation amount (i.e. mm/day) used as threshold for the event definition.

Figure A10: The station locations used for the cross-validation of precipitation are marked with red dots. The black dots show the stations used to produce precipitation in NGCD version 18.03.
In Figure A11, the POD is shown. The boxplot medians show that NGCD-1 has a higher hit-rate (i.e. correctly predict a "yes" event) than NGCD-2, except for the highest threshold of 25 mm. It is worth remarking that the POD spread for type 1 is larger than for type 2. In Figure A12, it is shown that the risk of having false alarms (i.e. an observed "no" events incorrectly predicted as "yes") is higher for NGCD-2 than for NGCD-1, for all thresholds. The ETS measures the fraction of observed events that were correctly predicted, adjusted for hits associated with random chance. Figure A13 shows that NGCD-1, on average, performs better than NGCD-2 in terms of ETS. Once again, the ETS boxplots for NGCD-2 are characterized by a narrower spread than those of NGCD-1, which indicates that the performances of NGCD-2 are more stable than those of NGCD-1. The bias, shown in Figure A14, is a measure of the accuracy of the spatial analysis method. NGCD-1 underestimates precipitation for all thresholds, while NGCD-2 shows a good fit (i.e. median close to 1) for the smaller thresholds and underestimates the larger precipitation values. NGCD-2 also shows less spread for the large values of precipitation.
Referring to the boxplot medians shown in Figures A11-A14, NGCD-1 often performs better than NGCD-2. We conclude that NGCD-1 provides more accurate estimates of the independent, validating observations than NGCD-2. A possible explanation is that the triangulation technique used for NGCD-1 is a more local interpolation method than the method used for NGCD-2, which results in a larger degree of spatial smoothing.
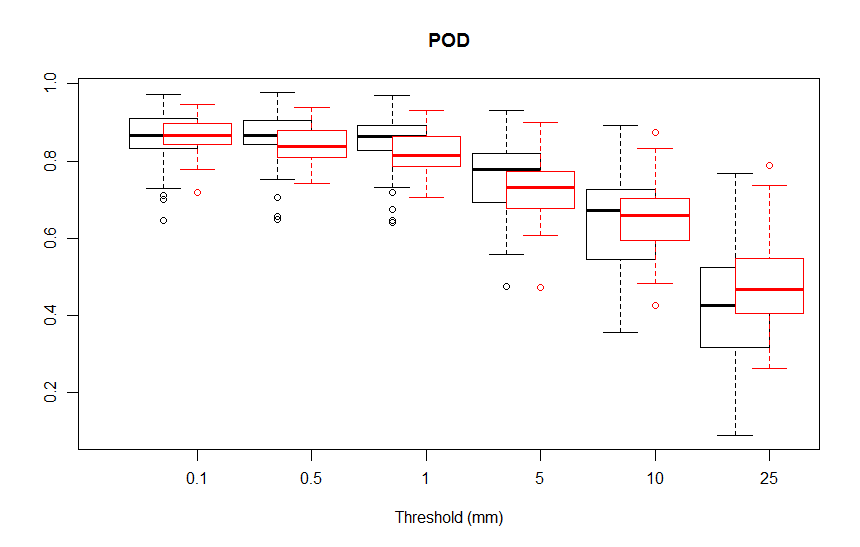
Figure A11: Probability of detection (POD, dimensionless) of daily precipitation totals (RR) for events exceeding given thresholds (0.1,0.5,1,5,10 and 25 mm) for NGCD-1 (black boxes) and NGCD-2 (red boxes).

Figure A12: Probability of false detection (FAR, dimensionless) of daily precipitation totals (RR) for events exceeding given thresholds (0.1,0.5,1,5,10 and 25 mm) for NGCD-1 (black boxes) and NGCD-2 (red boxes).

Figure A13: Equitable threat score (ETS, dimensionless) of daily precipitation totals (RR) for events exceeding given thresholds (0.1,0.5,1,5,10 and 25 mm) for NGCD-1 (black boxes) and NGCD-2 (red boxes)

Figure A14: Bias score (dimensionless) of daily precipitation totals (RR) for events exceeding given thresholds (0.1,0.5,1,5,10 and 25 mm) for NGCD-1 (black boxes) and NGCD-2 (red boxes).
Appendix B - Example file structure
Example file structure can be seen directly from the web-browser at the following URLs.
Var | URL with example of file structure |
RR | |
TG | |
TX | |
TN |
References
Klein Tank, A. M., Wijngaard, J. B., Können, G. P., Böhm, R. , Demarée, G. , Gocheva, A. , Mileta, M., Pashiardis, S. , Hejkrlik, L. , Kern‐Hansen, C. , Heino, R. , Bessemoulin, P. , Müller‐Westermeier, G. , Tzanakou, M. , Szalai, S. , Pálsdóttir, T. , Fitzgerald, D. , Rubin, S. , Capaldo, M. , Maugeri, M. , Leitass, A. , Bukantis, A. , Aberfeld, R. , van Engelen, A. F., Forland, E. , Mietus, M. , Coelho, F. , Mares, C. , Razuvaev, V. , Nieplova, E. , Cegnar, T. , Antonio López, J. , Dahlström, B. , Moberg, A. , Kirchhofer, W. , Ceylan, A. , Pachaliuk, O. , Alexander, L. V. and Petrovic, P. (2002), Daily dataset of 20th‐century surface air temperature and precipitation series for the European Climate Assessment. Int. J. Climatol., 22: 1441-1453. doi:10.1002/joc.773
