Colour gradients offer an easy and effective way to define stunning colour schemes for contour plotting. The idea behind the colour gradients is that we just define a few waypoints representing certain colours then the colours between the waypoints are automatically generated based on a user defined interpolation method and resolution.
To enable the colour gradient mode in the Contouring icon we need to use contour shading and set the Contour Shade Colour Method to "Gradients". This is how it looks in the Contouring icon editor:

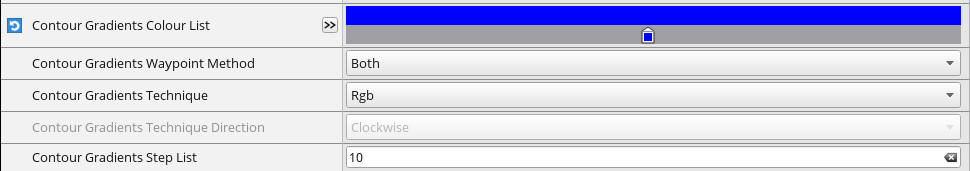
Having set this we need to scroll further down in the icon editor to find the gradient settings. This is what we can see by default: