-
Created by
 Michela Giusti, last updated on Jul 09, 2026
29 minute read
Michela Giusti, last updated on Jul 09, 2026
29 minute read
Introduction
Global Climate Models (GCM) can provide reliable climate information on global, continental and large regional scales covering what could be a vastly differing landscape (from very mountainous to flat coastal plains for example) with greatly varying potential for floods, droughts or other extreme events. Horizontal resolution limits the possibility to address smaller scale ranging from regional to local. Regional Climate Models (RCM) applied with higher spatial resolution over a limited area and driven by GCMs can provide more appropriate information on such smaller scales supporting more detailed impact and adaptation assessment and planning. Therefore Regional Climate Models (RCMs) have an important role to play by providing projections with much greater detail and more accurate representation of localized extreme events.
Regional climate projections are results from regional climate model simulations which have been generated by multiple independent climate research centres in the framework of the Coordinated Regional Climate Downscaling (CORDEX) supported by the World Climate Research Program (WCRP) and assessed by the Intergovernmental Panel on Climate Change (IPCC). These regional climate projections underpin the conclusion of the IPCC 5th Assessment Report (published in 2003) that “Continued emission of greenhouse gases will cause further warming and long-lasting changes in all components of the climate system, increasing the likelihood of severe, pervasive and irreversible impacts for people and ecosystems”.
The regional climate projections in the Climate Data Store (CDS) are a quality-controlled subset of the wider CORDEX dataset. The CORDEX vision is to advance and coordinate the science and application of regional climate downscaling through global partnerships. It aims to evaluate regional climate model performance through a set of experiments aiming at producing regional climate projections. The goals of CORDEX are:
- To better understand relevant regional/local climate phenomena, their variability and changes, through downscaling,
- To evaluate and improve regional climate downscaling models and techniques,
- To produce coordinated sets of regional downscaled projections worldwide,
- To foster communication and knowledge exchange with users of regional climate information.
A set of 26 core variables (17 for non-European domains, corresponding to surface fields, see the table below) from the CORDEX archive were identified for the CDS. These are the most used variables of the CORDEX datasets. These variables are provided from 5 CORDEX experiment types (evaluation, historical and 3 RCP scenarios) that are derived (downscaled) from the CMIP5 experiments. The temporal resolution is 3-hourly, 6-hourly, daily, monthly or seasonal information. Please note that for the non-European domains only daily datasets are available.
The CDS subset of CORDEX data have been through a metadata quality control procedure which ensures a high standard of reliability of the data. It may be for example that similar data can be found in the main CORDEX archive at the ESGF (Earth System Grid Federation) however these data come with no quality assurance and may have metadata errors or omissions. The quality-control process means that the CDS subset of CORDEX data is further reduced to exclude data that have metadata errors or inconsistencies. It is important to note that passing of the quality control should not be confused with validity: for example, it will be possible for a file to have fully compliant metadata but contain gross errors in the data that have not been noted. In other words, it means that the quality control is purely technical and does not contain any scientific evaluation (for instance consistency check).
Additional efforts (and funding) were devoted to support CORDEX activities by 1) providing support to archive in the ESGF relevant simulations available from the modelling centres for non-European domains not otherwise published in the ESGF nodes, and 2) making new simulations for the EURO-CORDEX domains. These activities are contributing to a significant enhancement of the regional climate model matrix over different domains in terms of emission scenarios, global model forcing and regional climate models.
The effort done by Copernicus to consolidate a World-wide CORDEX dataset is also contributing to the IPCC-AR6 WGI activities, providing a curated dataset to be assessed together with global climate information from CMIP experiments, in particular in the Interactive Atlas (IPCC-IA, https://interactive-atlas.ipcc.ch/), a new product of the IPCC allowing exploration of observed and projected climate data to complement the assessment of relevant datasets undertaken in the WGI chapters of IPCC. The C3S CORDEX dataset as a contribution to the IPCC Atlas is described in detail in Diez-Sierra et al., 2022. The data underpinning the IPCC-IA is also available in the CDS at https://cds.climate.copernicus.eu/datasets/multi-origin-c3s-atlas?tab=overview.
In addition, CORDEX data for CDS includes Persistent IDentifiers (PID) in their metadata which allows CDS users to report any error during the scientific analysis. The error will be at least documented on the ESGF Errata Service (http://errata.es-doc.org), but also planned to be documented in the CDS. The CDS aims to publish only the latest versions of the datasets.
Domains
We publish simulations for all CORDEX domains worldwide and consequently all 14 domains are available in the CDS. The dataset was aligned with the CORDEX/RCM data underpinning the AR6 report of IPCC. More details of the entire list of CORDEX domains can be found at https://cordex.org/domains/.
Please note that the domains are not on regular grids (refer to domain details links for information on the grids used). Projections may differ depending on the domain and the Regional Climate Model (RCM). The coordinates below are the approximate maximum and minimum values of the domain window (see more details at https://cordex.org/domains/.
As a summary, the available domains are:
*The MENA domain is sometimes referred to with the acronym MNA in the names of files retrieved from the CDS, as served from ESGF.
Experiments
The CDS-CORDEX subset consists of the following CORDEX experiments partly derived from the CMIP5 ones:
- evaluation: model simulations for the past with imposed "perfect" lateral boundary condition following ERA-Interim reanalyses (1979-2015).
- historical: model simulations for the past using lateral boundary conditions from Global Climate Models (GCMs). These experiments cover a period for which modern climate observations exist. These experiments show how the RCMs perform for the past climate when forced by GCMs and can be used as a reference period for comparison with scenario runs for the future.
- scenario experiments RCP2.6, RCP4.5, RCP8.5: ensemble of CORDEX climate projection experiments driven by boundary conditions from GCMs using RCP (Representative Concentration Pathways) forcing scenarios. The scenarios used here are RCP 2.6, 4.5 and 8.5, they provide different pathways of the future climate forcing. Further details on the emission scenarios used for CMIP5 can be found in Moss et al., 2010.
Driving Global Climate Models and Regional Climate Models
Regional Climate Model (RCM) simulations needs lateral boundary conditions from Global Climate Models (GCMs). At the moment the CDS-CORDEX subset boundary conditions are extracted from CMIP5 global projections.
The C3S EURO-CORDEX subset aims to fill the gaps in this matrix between GCMs (aka "driving models), RCMs and RCPs. This will ensure better representation of uncertainties coming from GCMs, RCMs and RCP scenarios and make possible to study the regional climate change signals in a more comprehensive fashion.
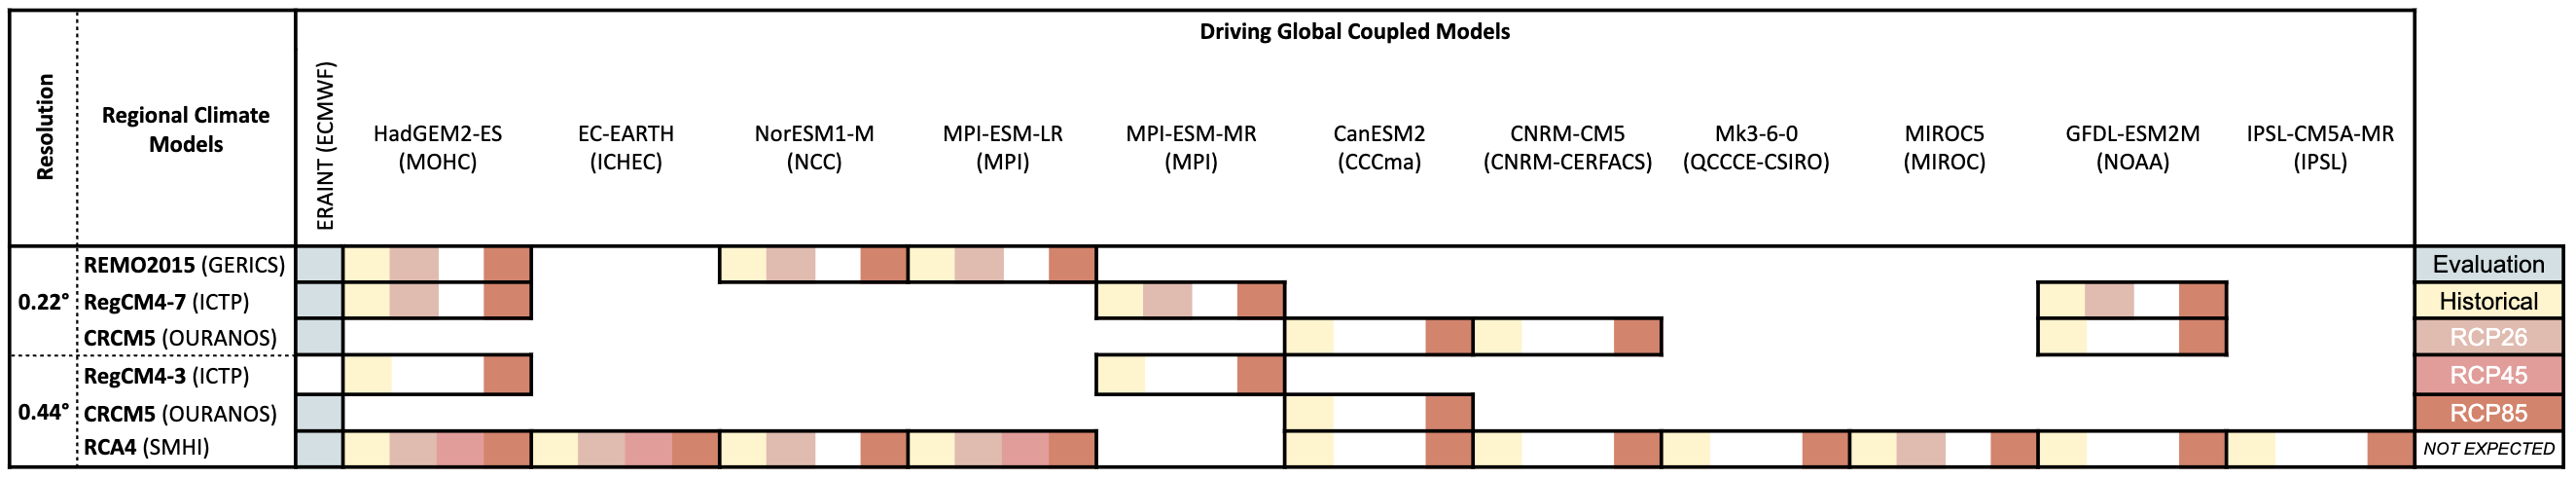
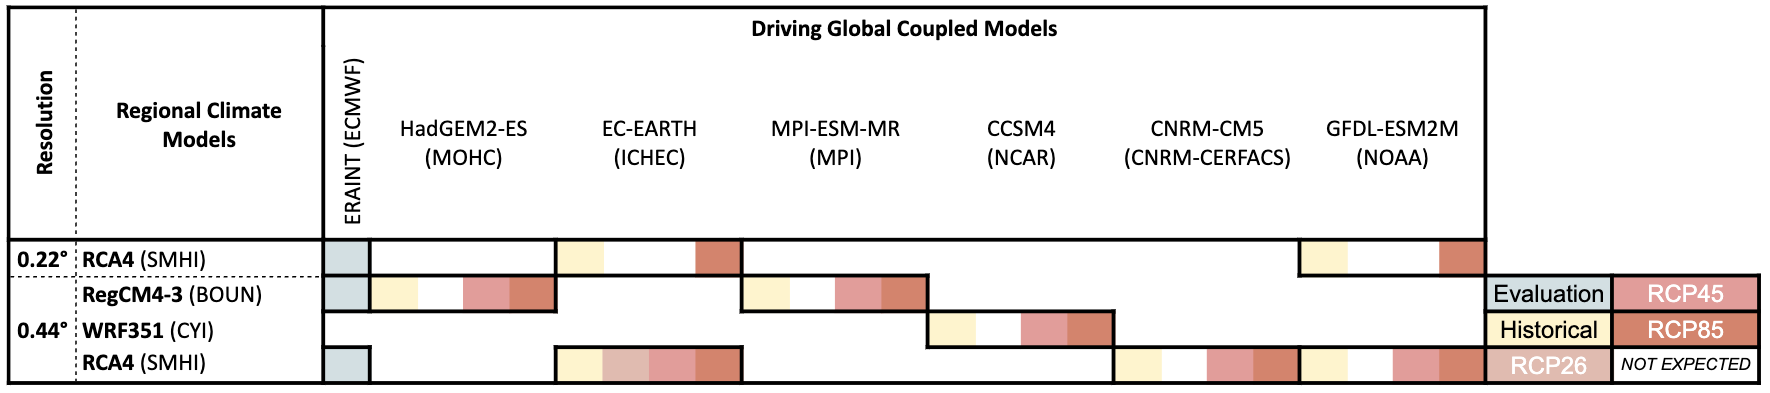
The driving GCM and RCM models included in the CDS-CORDEX subsets for the different domains available are detailed in the tables below. Note that the ensembles for different domains are formed by different GCM and RCM combinations from the main CMIP5 and CORDEX archives, respectively: these include 8 GCMs and 13 RCMs for EURO-CORDEX, 8 GCMs and 5 RCMs for Med-CORDEX, 8 GCMs and 8 RCMs for North-America CORDEX, and 5 GCMs and 6 RCMs for the Arctic. Please note that a small number of models were not included as those data have a research-only restriction on their use, while the data presented in the CDS are released without any restriction.
See detailed information about the RCMs used for CORDEX at https://www.ipcc.ch/report/ar6/wg1/downloads/report/IPCC_AR6_WGI_AnnexII.pdf (Tables AII.1, AII.2, AII.3 and AII.4). Additionally, the dataset, including key model details, is described in Diez-Sierra et al., 2022 .
Most of the Regional Climate Models that ran simulations over the European domain is documented through the Earth-System Documentation (ES-DOC) which provides a standardised and easy way to document climate models. See details at https://search.es-doc.org/?project=cordexp
In the tables below, please see the GCM-RCM and experiment combinations available for each published domain.
AFR-CORDEX:

ANT-CORDEX:

ARC-CORDEX:

AUS-CORDEX:

CAM-CORDEX:
CAS-CORDEX:

EAS-CORDEX:

EURO-CORDEX:

Med-CORDEX:

MENA-CORDEX:
NAM-CORDEX:

SAM-CORDEX:

WAS-CORDEX:

SEA-CORDEX:

Ensembles
The boundary conditions used to run a RCM are also identified by the model member if the CMIP5 simulation used. Each modelling centre typically run the same experiment using the same GCM several times to confirm the robustness of results and inform sensitivity studies through the generation of statistical information. A model and its collection of runs is referred to as an ensemble. Within these ensembles, three different categories of sensitivity studies are done, and the resulting individual model runs are labelled by three integers indexing the experiments in each category.
- The first category, labelled “realization”, performs experiments which differ only in random perturbations of the initial conditions of the experiment. Comparing different realizations allow estimation of the internal variability of the model climate.
- The second category refers to variation in initialization parameters. Comparing differently initialized output provides an estimate of how sensitive the model is to initial conditions.
- The third category, labelled “physics”, refers to variations in the way in which sub-grid scale processes are represented. Comparing different simulations in this category provides an estimate of the structural uncertainty associated with choices in the model design.
Each member of an ensemble is identified by a triad of integers associated with the letters r, i and p which index the “realization”, “initialization” and “physics” variations respectively. For instance, the member "r1i1p1" and the member "r1i1p2" for the same model and experiment indicate that the corresponding simulations differ since the physical parameters of the model for the second member were changed relative to the first member.
It is very important to distinguish between variations in experiment specifications, which are globally coordinated across all the models contributing to CMIP5, and the variations which are adopted by each modelling team to assess the robustness of their own results. The “p” index refers to the latter, with the result that values have different meanings for different models, but in all cases these variations must be within the constraints imposed by the specifications of the experiment.
For the scenario experiments, the ensemble member identifier is preserved from the historical experiment providing the initial conditions, so RCP 4.5 ensemble member “r1i1p2” is a continuation of historical ensemble member “r1i1p2”.
For CORDEX data, the ensemble member is equivalent to the ensemble member of the CMIP5 simulation used to extract boundary conditions.
List of published parameters
The table below lists the variables provided (the bold face items are available for all domains, the rest is only for Europe) at 3-hourly, 6-hourly, daily, monthly and seasonal temporal scale (for non-European domains only daily data are available).
Orography and land area fraction variables are time independent model fields.
| Name | Short name | Units | Description |
|---|---|---|---|
| 2m temperature | tas | K | The temperature of the air near the surface (or ambient temperature). The data represents the mean over the aggregation period at 2m above the surface. |
| 200hPa temperature | ta200 | K | The temperature of the air at 200hPa. The data represents the mean over the aggregation period at 200hPa pressure level. |
| Minimum 2m temperature in the last 24 hours | tasmin | K | The minimum temperature of the air near the surface. The data represents the daily minimum at 2m above the surface. |
| Maximum 2m temperature in the last 24 hours | tasmax | K | The maximum temperature of the air near the surface. The data represents the daily maximum at 2m above the surface. |
| Mean precipitation flux | pr | kg.m-2.s-1 | The deposition of water to the Earth's surface in the form of rain, snow, ice or hail. The precipitation flux is the mass of water per unit area and time. The data represents the mean over the aggregation period. |
| Mean evaporation flux | evspsbl | kg.m-2.s-1 | The mass of surface and sub-surface liquid water per unit area ant time, which evaporates from land. The data includes conversion to vapour phase from both the liquid and solid phase, i.e., includes sublimation, and represents the mean over the aggregation period. |
| 2m surface relative humidity | hurs | % | The relative humidity is the percentage ratio of the water vapour mass to the water vapour mass at the saturation point given the temperature at that location. The data represents the mean over the aggregation period at 2m above the surface. |
| 2m surface specific humidity | huss | Dimensionless | The amount of moisture in the air at 2m above the surface divided by the amount of air plus moisture at that location. The data represents the mean over the aggregation period at 2m above the surface. |
| Surface pressure | ps | Pa | The air pressure at the lower boundary of the atmosphere. The data represents the mean over the aggregation period. |
| Mean sea level pressure | psl | Pa | The air pressure at sea level. In regions where the Earth's surface is above sea level the surface pressure is used to compute the air pressure that would exist at sea level directly below given a constant air temperature from the surface to the sea level point. The data represents the mean over the aggregation period. |
| 10m Wind Speed | sfcWind | m.s-1 | The magnitude of the two-dimensional horizontal air velocity. The data represents the mean over the aggregation period at 10m above the surface. |
| Surface solar radiation downwards | rsds | W.m-2 | The downward shortwave radiative flux of energy per unit area. The data represents the mean over the aggregation period at the surface. |
| Surface thermal radiation downward | rlds | W.m-2 | The downward longwave radiative flux of energy inciding on the surface from the above per unit area. The data represents the mean over the aggregation period. |
| Surface upwelling shortwave radiation | rsus | W.m-2 | The upward shortwave radiative flux of energy from the surface per unit area. The data represents the mean over the aggregation period at the surface. |
| Total cloud cover | clt | Dimensionless | Total refers to the whole atmosphere column, as seen from the surface or the top of the atmosphere. Cloud cover refers to fraction of horizontal area occupied by clouds. The data represents the mean over the aggregation period. |
| 500hPa geopotential | zg500 | m | The gravitational potential energy per unit mass normalized by the standard gravity at 500hPa at the same latitude. The data represents the mean over the aggregation period at 500hPa pressure level. |
| 10m u-component of wind | uas | m.s-1 | The magnitude of the eastward component of the wind. The data represents the mean over the aggregation period at 10m above the surface. |
| 10m v-component of wind | vas | m.s-1 | The magnitude of the northward component of the wind. The data represents the mean over the aggregation period at 10m above the surface. |
| 200hPa u-component of the wind | ua200 | m.s-1 | The magnitude of the eastward component of the wind. The data represents the mean over the aggregation period at 200hPa above the surface. |
| 200hPa v-component of the wind | va200 | m.s-1 | The magnitude of the northward component of the wind. The data represents the mean over the aggregation period at 200hPa pressure level. |
| 850hPa U-component of the wind | ua850 | m.s-1 | The magnitude of the eastward component of the wind. The data represents the mean over the aggregation period at 850hPa pressure level. |
| 850hPa V-component of the wind | va850 | m.s-1 | The magnitude of the northward component of the wind. The data represents the mean over the aggregation period at 850hPa pressure level. |
| Total run-off flux | mrro | kg.m-2.s-1 | The mass of surface and sub-surface liquid water per unit area and time, which drains from land. The data represents the mean over the aggregation period. |
| Mean evaporation flux | evspsbl | kg.m-2.s-1 | The mass of surface and sub-surface liquid water per unit area ant time, which evaporates from land. The data includes conversion to vapour phase from both the liquid and solid phase, i.e., includes sublimation, and represents the mean over the aggregation period. |
| Land area fraction | sftlf | % | The fraction (in percentage) of grid cell occupied by land surface. The data is time-independent. |
| Orography | orog | m | The height above the geoid (being 0.0 over the ocean). The data is time-independent. |
Data format
The CDS subset of CORDEX data are provided as NetCDF files. NetCDF (Network Common Data Form) is a file format that is freely available and commonly used in the climate modelling community. See the more details: What are NetCDF files and how can I read them
A CORDEX NetCDF file in the CDS contains:
- Global metadata: these fields can describe many different aspects of the file such as
- when the file was created,
- the name of the institution and model used to generate the file
- links to peer-reviewed papers and technical documentation describing the climate model,
- the persistent identifier used to track the file annotations,
- links to supporting documentation on the climate model used to generate the file,
- software used in post-processing.
- variable dimensions: such as time, latitude, longitude and height
- variable data: the gridded data
- variable metadata: e.g. the variable units, averaging period (if relevant) and additional descriptive data
The metadata provided in NetCDF files adhere to the Climate and Forecast (CF) conventions. The rules within the CF-conventions ensure consistency across data files, for example ensuring that the naming of variables is consistent and that the use of variable units is consistent.
File naming conventions
When you download a CORDEX file from the CDS it will have a naming convention that is as follows:
<variable>_<domain>_<driving-model>_<experiment>_<ensemble_member>_<rcm-model>_<rcm-run>_<time-frequency>_<temporal-range>.nc
Where
- <variable> is a short variable name, e.g. “tas” for ”temperature at the surface”
- <driving-model> is the name of the model that produced the boundary conditions
- <experiment> is the name of the experiment used to extract the boundary conditions
- <ensemble-member> is the ensemble identifier in the form “r<X>i<Y>p<Z>”, X, Y and Z are integers
- <rcm-model> is the name of the model that produced the data
- <rcm-run> is the version run of the model in the form of "vX" where X is integer
- <time-frequency> is the time series frequency (e.g., monthly, daily, seasonal)
- the <temporal-range> is in the form YYYYMM[DDHH]-YYYY[MMDDHH], where Y is year, M is the month, D is day and H is hour. Note that day and hour are optional (indicated by the square brackets) and are only used if needed by the frequency of the data. For example daily data from the 1st of January 1980 to the 31st of December 2010 would be written 19800101-20101231.
Spatial and temporal subsetting
From July 2026 onwards spatial and temporal subsetting were enabled in the CORDEX catalogue entry on the CDS. More details are provided below.
Temporal subsetting:
Previously, data had to be requested in fixed temporal chunks, which were linked to the content of the separate data files on disk. Users had to specify "Start year" and "End year" in the CDS form. Now any combination of available years and months can be requested using the new "Year" and "Month" widgets (depending on other selections in the form, or via the API by setting "year": ["YYYY", ...] and "month": ["MM", ...]), and the resulting data will be concatenated into a single file.
Spatial subsetting:
It is now possible to requests spatial subsets of the CORDEX data, by defining a lat-lon bounding box in the CDS form or via the API (with "area": [S, W, N, E], with a maximum of two decimal places on the lat-lon values). However, please note that the returned data will not be provided on a regular lat-lon grid bounded by the requested area, but on a sub-area of the original model data grid. If the requested region extends beyond the CORDEX domain, it will be clipped to the domain extent (see Examples 3 and 4 below), and if the requested region does not intersect at all with the specific CORDEX domain selected, the request will fail. Additionally, since the CORDEX data are provided on limited-area rotated pole grids (or similar), some areas of the returned files will be filled with missing values (NaNs), where the rotated pole grid and the requested lat-lon box do not intersect. Some examples are shown below.
Example 1: The North American domain is selected, and 'Whole available region' is selected (no area subsetting). Note that if subsetting is activated, and a domain larger than the selected domain is requested, then the same result is obtained as the request is clipped to the domain extent (no additional missing values are added to comply with the user defined box). The white area is outside of the data grid and just an effect of plotting the rotated pole grid on a regular lat-lon projection.

Example 2: The North American domain is selected, and the following values are used for the 'Sub-region extraction' values; west = -127, north = 40, east = -123, south = 29 (in an API request this would be set with "area": [40, -127, 29, -123]). The combination of the grey areas and plotted values represents the returned grid, and the grey areas are where the rotated pole grid does not intersect with the requested lat-lon box, but the cells are included to define a rectangular box in the coordinates of the original grid (so they are masked with missing values).

Example 3: The North American domain is selected, and the following values are used for the 'Sub-region extraction' values; west = -120, north = 20, east = -80, south = 10 (in an API request this would be set with "area": [10, -120, 20, -80]). The combination of the grey areas and plotted values represents the returned grid, and the grey areas are where the rotated pole grid does not intersect with the requested lat-lon box, but the cells are included to define a rectangular box in the coordinates of the original grid (so they are masked with missing values). The grid of the returned data does not extend outside of the domain of the original grid, despite the requested box extending beyond it.

Example 4: The North American domain is selected, and the following values are used for the 'Sub-region extraction' values; west = -40, north = 90, east = 0, south = 50 (in an API request this would be set with "area": [90, -40, 50, 0]). The combination of the grey areas and plotted values represents the returned grid, and the grey areas are where the rotated pole grid does not intersect with the requested lat-lon box, but the cells are included to define a rectangular box in the coordinates of the original grid (so they are masked with missing values). The grid of the returned data does not extend outside of the domain of the original grid, despite the requested box extending beyond it.

Quality control of the CDS-CORDEX subset
The CDS subset of the CORDEX data have been through a set of quality control checks before being made available through the CDS. The objective of the quality control process is to ensure that all files in the CDS meet a minimum standard. Data files were required to pass all stages of the quality control process before being made available through the CDS. Data files that fail the quality control process are excluded from the CDS-CORDEX subset or if possible the error is corrected and a note made in the history attribute of the file. The quality control of the CDS-CORDEX subset checks for metadata errors or inconsistencies against the Climate and Forecast (CF) Conventions and a set of CORDEX specific file naming and file global metadata conventions.
Various software tools have been used to check the metadata:
- The Quality Assurance compliance checking tool from DKRZ is used to check that:
- the file name adheres to the CORDEX file naming convention,
- the global attributes of the NetCDF file are consistent with filename,
- there are no omissions of required CORDEX metadata.
- The CF-Checker Climate and Forecast (CF) conventions checker (included in the QA-DKRZ) ensures that any metadata that is provided is consistent with the CF conventions.
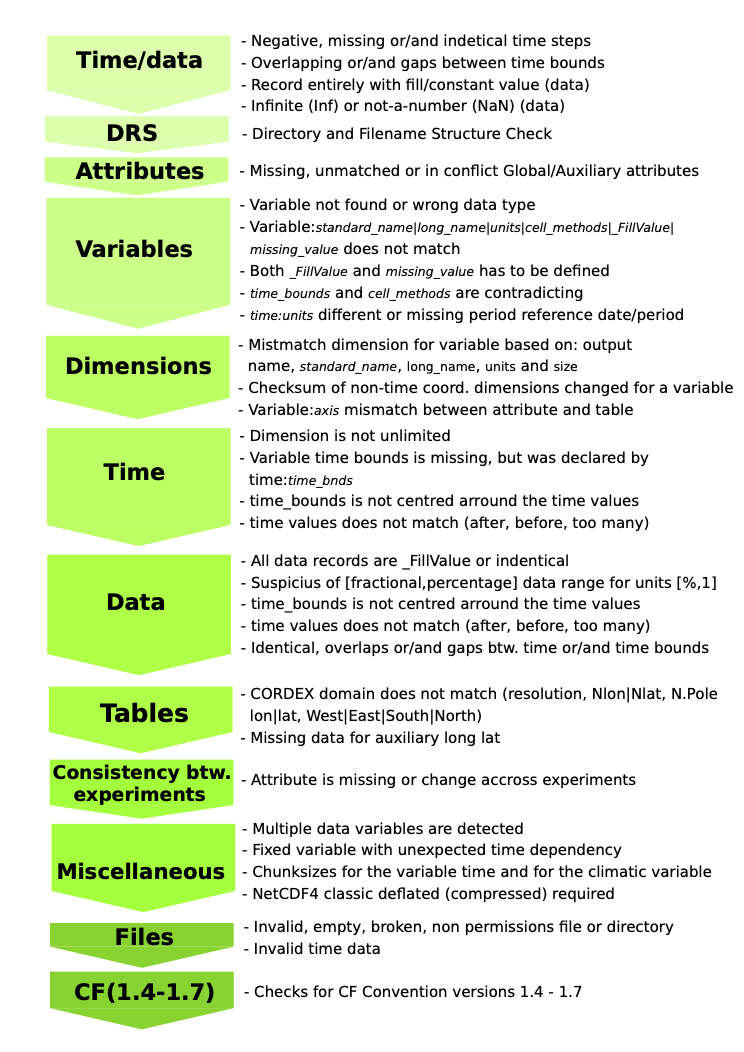
The figure below shows a scheme that classifies the tests performed by the QA-DKRZ tool in twelve categories (in green) showing the specific tests/checks in each case.
- When possible (i.e., optional), the Time Axis checker developed by the IPSL is used to check the temporal dimension of the data:
- for individual files the time dimension of the data is checked to ensure it is valid and is consistent with the temporal information in the filename,
- where more than one file is required to generate a time-series of data, the files have been checked to ensure there are no temporal gaps or overlaps between the files.
The data within the files were not individually checked, therefore it is important to note that passing of these quality control tests should not be confused with validity: for example, it will be possible for a file to be fully CF compliant and have fully compliant metadata but contain gross errors in the data that have not been revealed.
Citation and PID information
The users can decide on what level they want to refer to the CORDEX datasets.
The highest level is the one provided by the CDS with the use of the following DOI (Digital Object Identifier): 10.24381/cds.bc91edc3 (available also at the right-hand-side of the entry). The users can refer to any data with this DOI, which are available in the CORDEX catalogue entry in the CDS.
Citations might be manually found by using the WDCC user interface at https://www.wdc-climate.de/, however it is not ensured that this information is up-to-date and relevant for the CORDEX datasets published in the CDS.
The CORDEX datasets are also labelled by the so called Persistent Identifiers (PIDs). PIDs are assigned to each version of every file and dataset. These are unique identifiers of the data and they are available in the header of the netcdf datafiles. The PIDs are also provided on dataset and file levels (please note that these files are csv files, which can be looked at after downloading them).
Known issues
All known issues about CORDEX data are documented through the ES-DOC Errata Service. The Errata Service also includes a command-line interface and an API to request the issue database for a specific dataset or file.
Please note that we have updated the catalogue entry on 14/12/2022 and we have removed some old, obsolete datasets and replaced them by their latest versions. This concerns the following models and simulations:
- EUR-11 domain:
- GERICS/ICHEC-EC-EARTH/rcp45/REMO2015
- DMI/ICHEC-EC-EARTH/historical/DMI-HIRHAM5
- DMI/ICHEC-EC-EARTH/rcp26/r3i1p1/DMI-HIRHAM5
- DMI/ICHEC-EC-EARTH/rcp45/DMI-HIRHAM5
- DMI/ICHEC-EC-EARTH/rcp85/DMI-HIRHAM5
DMI/MOHC-HadGEM2-ES/historical/DMI-HIRHAM5
- DMI/MOHC-HadGEM2-ES/rcp85/DMI-HIRHAM5
DMI/NCC-NorESM1-M/historical/DMI-HIRHAM5
DMI/NCC-NorESM1-M/rcp45/DMI-HIRHAM5
DMI/NCC-NorESM1-M/rcp85/DMI-HIRHAM5
- AFR-44 domain:
- AFR-44/DMI/ECMWF-ERAINT/evaluation/DMI-HIRHAM5
- MED-44 domain:
- ICTP/ECMWF-ERAINT/evaluation/ICTP-RegCM4-3
- ICTP/MOHC-HadGEM2-ES/historical/ICTP-RegCM4-3
In addition:
- Please have a look on the Errata Service to be warned about deprecated CORDEX runs that will be retracted in the future.
- Please note that not all combinations of models and domains exists. This feature is due to the different CORDEX initiatives/consortiums that do not involve the same data producers using the same RCMs.
- Please note that not all the combinations of models and variables exist. This feature is inherited from the ESGF system, where the main target is to publish as much as possible data and even publish incomplete datasets, which might be of use. This allows to have more data available with the price that not everything is fully complete.
- There is a metadata inconsistency issue for the CCCMA_CANESM2/CCCMA_CANRCM4 model for the NAM-22 domain. The geospatial metadata available in the file is incorrect, which results in a shift of the data values with respect to the continent contours while plotting. A new errata note was created, see at https://errata.ipsl.fr/static/view.html?uid=6493a0cc-f2ab-130b-95d2-6aa2a36dd2cf and simultaneously the problem was reported back to the data producers.
- Issues have been detected with some fields from the RCM, CLMcom-CLM-CCLM4-8-17, including clt, rlds, ps, pr, rsus. In particular, there may be isolated non-physical values for some grid cells.
Some additional minor points which are useful to note:
- For some GCM-RCM combinations, due to the nature of the model configuration, the data surrounding the RCM domain is still included by the files served from ESGF (which would mean that even a global domain might be provided). This will be apparent from the latitude and longitude coverage of the file obtained, and the high resolution domain needs to be extracted (for example LMDZ4NEMOMED8).
Background documents and user guides
There is a very useful User Guide prepared by the EURO-CORDEX community which is providing guidance how to use EURO-CORDEX climate projection data. This EURO-CORDEX User Guide is available at https://www.euro-cordex.net/imperia/md/content/csc/cordex/guidance_for_euro-cordex_climate_projections_data_use__2021-02_1_.pdf.
The spatial overlaps of the different CORDEX domains provides an opportunity for building grand ensembles by pulling together all the existing simulations from the different domains. Although this could in principle create some heterogeneity and/or duplication, there are recent studies that use and support this option (https://doi.org/10.1175/JCLI-D-19-0084.1 ), though further research is still needed to assess the resulting grand ensembles (see for instance https://doi.org/10.1029/2019GL086799 ).
The documents below were provided by the data supplier as background information on the creation of the EURO-CORDEX data stored in the Climate Data Store (CDS) for the benefit of the CORDEX data users.
- Description and user guide of the worldwide CORDEX C3S dataset assessing potential conflicts due to overlaps
This document provides some guidelines how to use worldwide CORDEX data in overlapping regions.
- Experimental design for the GCM/RCM Matrix (29/06/2018)
This report documents how the new EURO-CORDEX experiment is designed in terms of which GCM-RCM-RCP combinations to run in the project. This was produced quite some time ago, therefore the presented information is not fully up-to-date, but nevertheless provides a fairly good idea about the concept for designing new experiments.
- Documentation for the use of pattern scaling with particular focus on Europe (25/04/2019)
This report documents results from the 34 EURO-CORDEX RCP8.5 simulations. For a number of European subregions we present patterns describing the regional climate change in relation to the change in global mean temperature. These patterns are derived as the linear fit between regional climate change and change in global mean temperature. This is a commonly used method and can be seen as the standard definition of pattern scaling used in the scientific literature. For the calculation of these patterns the climate change signal was derived for three different time windows (2011-2040, 2041-2070 and 2071-2100) w.r.t. the control climate (1971-2000)
- Decide on experimental setup for internal variability (28/02/2018)
Internal variability is an intrinsic character of the climate system and it is also present in climate models. The design to run new RCM experiments took into account the intention that the internal variability can be studied. This report present some early investigations on these aspects for the EURO-CORDEX domain.
- Synthesis report (15/10/2021)
In this report we review the EURO-CORDEX ensemble, which now contains altogether around 130 members (from which around half of them was prepared by the support of C3S). The report provides information about model biases and climate change trends what can be deduced with the help of the this particularly large RCM ensemble .
- Proposed method to assess the usability of the RCP-GCM-RCM modelling setup and description of the first results (28/02/2021)
C3S is aiming to build a EURO-CORDEX ensemble which is as complete as possible. By doing this, C3S will fill some of the missing elements of the EURO-CORDEX GCM-RCM-RCP uncertainty matrix. As we will have more simulations available (and these being complete sub-matrices, for instance), we are in a better position to assess how the full matrix can be reproduced when based on fewer available model simulations. In addition, we can determine how the missing model elements can be built. This unique study gives valuable insights into the optimal design of such ensemble systems in the future.
- Documentation for the role of internal variability for Europe (31/03/2021)
This report describes the regional and local effects of internal climate variability as described by two sets of downscaled data for two different three-member GCM ensembles and two downscaled single-model multi-member ensembles.
- A scientific assessment of the usability of the RCP-GCM-RCM setup (11/07/2021)
This report outlines a scientific assessment of the usability of the experimental setup for the choice of forcing scenarios (RCPs), global (GCMs) and regional climate models (RCMs), which has been used to decide what additional EURO-CORDEX simulations were performed for C3S.
- Differences between CMIP5 GCMs downscaled by EURO-CORDEX RCMs and the full CMIP5 and CMIP6 ensembles, with focus on Europe (29/06/2021)
This report analyses Global Climate Models (GCMs) for Europe covering the entire set of CMIP5 models, the CMIP5 models used for driving EURO-CORDEX Regional Climate Models (RCMs) and the available CMIP6 ensemble.
- Evaluation reports per domain and user guide (20/07/2021)
This report summarises the evaluation framework used for the worldwide CORDEX simulations. It explains the model diagnostic and evaluation tools and give a short summary how the provided plots can be interpreted.
- Validation framework (30/06/2021)
This report summarises the validation diagnostics deployed for the worldwide CORDEX simulations. It helps in the interpretation of the validation plots produced.
Additional resources
A training resource in python is available via a Jupyter Notebook on the C3S data tutorials page here: https://ecmwf-projects.github.io/copernicus-training-c3s/projections-cordex.html
The C3S EQC function produces quality assessments of CDS data in the form of Jupyter Notebooks. While these are in the context of specific user questions, they may serve as useful examples more generally. The assessments available for the CORDEX-CMIP5 data can be found here: https://ecmwf-projects.github.io/c3s2-eqc-quality-assessment/Climate_Projections/climate.html.
Frequently Asked Questions (FAQs)
There is a C3S regional climate projections User Forum that contains a number of FAQs related to CORDEX data. These questions and answers cover a wide range of topics and may be of interest to both any CORDEX data users and general climate projection data users.
References
THE ENTIRE C3S CORDEX GRAND-ENSEMBLE DATASET:
- Diez-Sierra, J., et al. (2022): The Worldwide C3S CORDEX Grand Ensemble: A Major Contribution to Assess Regional Climate Change in the IPCC AR6 Atlas. Bull. Amer. Meteor. Soc., 103, E2804–E2826, https://doi.org/10.1175/BAMS-D-22-0111.1.
AFR-CORDEX:
- Nikulin G, Lennard C, Dosio A, et al. (2018) The effects of 1.5 and 2 degrees of global warming on Africa in the CORDEX ensemble, Environ. Res. Lett., doi:10.1088/1748-9326/aab2b4, http://iopscience.iop.org/article/10.1088/1748-9326/aab1b1
- Nikulin G., Jones, C. , Giorgi, F., et al. (2013) Precipitation Climatology in An Ensemble of CORDEX-Africa Regional Climate Simulations, J. Climate, 25, 6057–6078. http://doi.org/10.1175/JCLI-D-11-00375.1
ANT-CORDEX:
- Kittel, C., Amory, C., Agosta, C., et al. (2021): Diverging future surface mass balance between the Antarctic ice shelves and grounded ice sheet, The Cryosphere, 15, 1215–1236, https://doi.org/10.5194/tc-15-1215-2021.
- Lenaerts, J. T. M., van den Broeke, M. R., van de Berg, W. J., van Meijgaard, E., and Kuipers Munneke, P. (2012), A new, high-resolution surface mass balance map of Antarctica (1979–2010) based on regional atmospheric climate modeling, Geophys. Res. Lett., 39, L04501, https://www.doi.org/10.1029/2011GL050713
- Mottram, R., Hansen, N., Kittel, C., et al. (2020) What is the Surface Mass Balance of Antarctica? An Intercomparison of Regional Climate Model Estimates, The Cryosphere Discuss. [preprint], https://doi.org/10.5194/tc-2019-333
ARC-CORDEX:
Inoue, J., Sato, K., Rinke, A., et al. (2021) Clouds and radiation processes in regional climate models evaluated using observations over the ice‐free Arctic Ocean, J. Geophys. Res. Atm., 126, e2020JD033904, http://doi.org/10.1029/2020JD033904
Sedlar, J., M. Tjernström, A. Rinke, et al. (2020) Confronting Arctic troposphere, clouds and surface energy budget representations in regional climate models with observations, J. Geophys. Res. Atm., 124, http://doi.org/10.1029/2019JD031783
Akperov, M., A. Rinke, I.I. Mokhov, et al. (2019) Future projections of cyclone activity in the Arctic for the 21st century from regional climate models (Arctic-CORDEX), Glob. Planet. Change, http://doi.org/10.1016/j.gloplacha.2019.103005
Diaconescu, E.P., Mailhot, A., Brown, R. et al. (2018) Evaluation of CORDEX-Arctic daily precipitation and temperature-based climate indices over Canadian Arctic land areas, Clim. Dyn., 50, 2061–2085, doi:doi.org/10.1007/s00382-017-3736-4
AUS-CORDEX:
- Di Virgilio, G., Evans, J.P., Di Luca, A. et al. (2019) Evaluating reanalysis-driven CORDEX regional climate models over Australia: model performance and errors. Clim Dyn 53, 2985–3005. https://doi.org/10.1007/s00382-019-04672-w
- Evans, J.P., Di Virgilio, G., Hirsch, A.L. et al. (2020) The CORDEX-Australasia ensemble: evaluation and future projections. Clim Dyn. https://doi.org/10.1007/s00382-020-05459-0
- Di Virgilio, G., Evans, J.P., Di Luca, A. et al. (2020) Realised added value in dynamical downscaling of Australian climate change. Clim Dyn 54, 4675–4692. https://doi.org/10.1007/s00382-020-05250-1
CAM-CORDEX:
- Cavazos, T, Luna-Niño, R, Cerezo-Mota, R, et al. (2020) Climatic trends and regional climate models intercomparison over the CORDEX-CAM (Central America, Caribbean, and Mexico) domain. Int J Climatol.; 40: 1396– 1420. https://doi.org/10.1002/joc.6276
- Luna-Niño, R., Cavazos, T., Torres-Alavez, J.A. et al. (2020) Interannual variability of the boreal winter subtropical jet stream and teleconnections over the CORDEX-CAM domain during 1980–2010. Clim Dyn. https://doi.org/10.1007/s00382-020-05509-7
CAS-CORDEX:
- Top, S., Kotova, L., De Cruz, L., et al. (2021) Evaluation of regional climate models ALARO-0 and REMO2015 at 0.22° resolution over the CORDEX Central Asia domain, Geosci. Model Dev., 14, 1267–1293, https://doi.org/10.5194/gmd-14-1267-2021
- Ozturk, T., Turp, M. T., Türkeş, M., & Kurnaz, M. L. (2017). Projected changes in temperature and precipitation climatology of Central Asia CORDEX Region 8 by using RegCM4.3.5. Atmospheric Research, 183, 296–307. https://doi.org/10.1016/j.atmosres.2016.09.008
EAS-CORDEX:
- Sun, H., Wang, A. et al (2018) Impacts of global warming of 1.5°C and 2.0°C on precipitation patterns in China by regional climate model (COSMO-CLM). Atmos Res 203:83–94. https://doi.org/10.1016/j.atmosres.2017.10.024
- Teichmann, C., Jacob, D., Remedio, A.R. et al. (2020) Assessing mean climate change signals in the global CORDEX-CORE ensemble. Clim Dyn. https://doi.org/10.1007/s00382-020-05494-x
EURO-CORDEX:
- Kotlarski, S., Keuler, K., Christensen, O. B., et al. (2014) Regional climate modeling on European scales: a joint standard evaluation of the EURO-CORDEX RCM ensemble, Geosci. Model Dev., 7, 1297–1333, https://doi.org/10.5194/gmd-7-1297-2014
- Jacob, D., Teichmann, C., Sobolowski, S. et al. (2020) Regional climate downscaling over Europe: perspectives from the EURO-CORDEX community. Reg Environ Change 20, 51. https://doi.org/10.1007/s10113-020-01606-9
- Christensen, O.B., Kjellström, E. Partitioning uncertainty components of mean climate and climate change in a large ensemble of European regional climate model projections. Clim Dyn (2020). https://doi.org/10.1007/s00382-020-05229-y
- Sørland SL, Schär C, Lüthi D, Kjellström E (2018) Bias patterns and climate change signals in GCM-RCM model chains. Environ Res Lett 13(7):074017. https://doi.org/10.1088/1748-9326/aacc77
Coppola E., Nogherott o R. , Ciarlò J.M. et al . (2021) Assessment of the European climate projections as simulated by the large EURO-CORDEX regional and global climate model ensemble. Journal of Geophysical Research – Atmospheres, https:// doi.org/ 10.1029/2019JD032356
V autard R., Kadygro v N. , Ile s C. et al. (2021) Evaluation of the large EURO-CORDEX regional climate model ensemble . Journal of Geophysical Research – Atmospheres, https:// doi.org/10.1029/2019JD032344
MED-CORDEX:
Ruti PM, Somot S, Giorgi F, et al. (201 6 ) MED-CORDEX initiative for Mediterranean Climate studies. Bull. Amer. Meteor. Soc. , 97(7), 1187-1208, July 2016, doi: http://dx.doi.org/10.1175/BAMS-D-14-00176.1, http://journals.ametsoc.org/doi/abs/10.1175/BAMS-D-14-00176.1
- Somot S., Ruti P., Ahrens B. et al. (2018 ). Editorial for the Med-CORDEX Special Issue. Clim. Dyn. 51(3):771-777, doi : 10.1007/s00382-018-4325-x, https://link.springer.com/article/10.1007/s00382-018-4325-x
- Med-CORDEX Special Issue, Climate Dynamics, volume 51, issue 3, 2018; https://link.springer.com/journal/382/volumes-and-issues/51-3
MENA-CORDEX:
- Zittis, G., Hadjinicolaou, P. and Lelieveld, J. (2014) Comparison of WRF Model Physics Parameterizations over the MENA-CORDEX Domain. American Journal of Climate Change, 3, 490-511. http://doi.org/10.4236/ajcc.2014.35042
- Almazroui, M. (2016) RegCM4 in climate simulation over CORDEX-MENA/Arab domain: selection of suitable domain, convection and land-surface schemes. Int. J. Climatol., 36: 236-251. https://doi.org/10.1002/joc.4340
- Bucchignani, E., Mercogliano, P., Rianna, G. and Panitz, H.-J. (2016) Analysis of ERA-Interim- driven COSMO-CLM simulations over Middle East – North Africa domain at different spatial resolutions. Int. J. Climatol., 36: 3346–3369. http://doi.org/10.1002/joc.4559
NAM-CORDEX:
- Bukovsky, M. S., and Mearns, L. O. (2020). Regional climate change projections from NA-CORDEX and their relation to climate sensitivity. Clim. Change 162, 645–665. https://link.springer.com/article/10.1007%2Fs10584-020-02835-x
SAM-CORDEX:
- Blázquez, J., Silvina, A.S. Multiscale precipitation variability and extremes over South America: analysis of future changes from a set of CORDEX regional climate model simulations. Clim Dyn 55, 2089–2106 (2020). https://doi.org/10.1007/s00382-020-05370-8
- Llopart, M., Simões Reboita, M. & Porfírio da Rocha, R. Assessment of multi-model climate projections of water resources over South America CORDEX domain. Clim Dyn 54, 99–116 (2020). https://doi.org/10.1007/s00382-019-04990-z
- Solman, S.A., Blázquez, J. Multiscale precipitation variability over South America: Analysis of the added value of CORDEX RCM simulations. Clim Dyn 53, 1547–1565 (2019). https://doi.org/10.1007/s00382-019-04689-1
- Falco, M., Carril, A.F., Menéndez, C.G. et al. Assessment of CORDEX simulations over South America: added value on seasonal climatology and resolution considerations. Clim Dyn 52, 4771–4786 (2019). https://doi.org/10.1007/s00382-018-4412-z
WAS-CORDEX:
- Sanjay J, Krishnan R, Shrestha AB, Rajbhandari R, Ren G-Y (2017) Downscaled climate change projections for the Hindu Kush Himalayan region using CORDEX South Asia regional climate models. Adv Clim Chang Res 8(3):185–198, https://doi.org/10.1016/j.accre.2017.08.003
SEA-CORDEX:
- Tangang, F., Chung, J.X., Juneng, L. et al. (2020) Projected future changes in rainfall in Southeast Asia based on CORDEX–SEA multi-model simulations. Clim Dyn 55, 1247–1267. https://doi.org/10.1007/s00382-020-05322-2
CORDEX-CORE (comprehensive and homogeneous projections across almost all CORDEX domains with 0.22º resolution):
- Teichmann, C., Jacob, D., Remedio, A.R. et al. (2020) Assessing mean climate change signals in the global CORDEX-CORE ensemble. Clim Dyn. https://doi.org/10.1007/s00382-020-05494-x
- Coppola, E., Raffaele, F., Giorgi, F. et al. (2021) Climate hazard indices projections based on CORDEX-CORE, CMIP5 and CMIP6 ensemble. Clim Dyn. https://doi.org/10.1007/s00382-021-05640-z
GENERAL REFERENCES:
- Moss, R., Edmonds, J., Hibbard, K. et al. The next generation of scenarios for climate change research and assessment. Nature 463, 747–756 (2010). https://doi.org/10.1038/nature08823
This document has been produced in the context of the Copernicus Climate Change Service (C3S).
The activities leading to these results have been contracted by the European Centre for Medium-Range Weather Forecasts, operator of C3S on behalf of the European Union (Delegation agreement signed on 11/11/2014). All information in this document is provided "as is" and no guarantee or warranty is given that the information is fit for any particular purpose.
The user thereof uses the information at its sole risk and liability. For the avoidance of all doubts, the European Commission and the European Centre for Medium-Range Weather Forecasts has no liability in respect of this document, which is merely representing the authors view.
Related articles
