Two layers help understand the potential impact of the flood signal of EFAS medium-range forecasts. The procedure is described on the EFAS website and is published in Dottori et al., 2017.
Rapid Flood Mapping
The figure below explains the Rapid Flood Mapping layer

Rapid Impact Assessment
The figures below explain the Rapid Impact Assessment layer
Mapviewer

Pop-out window
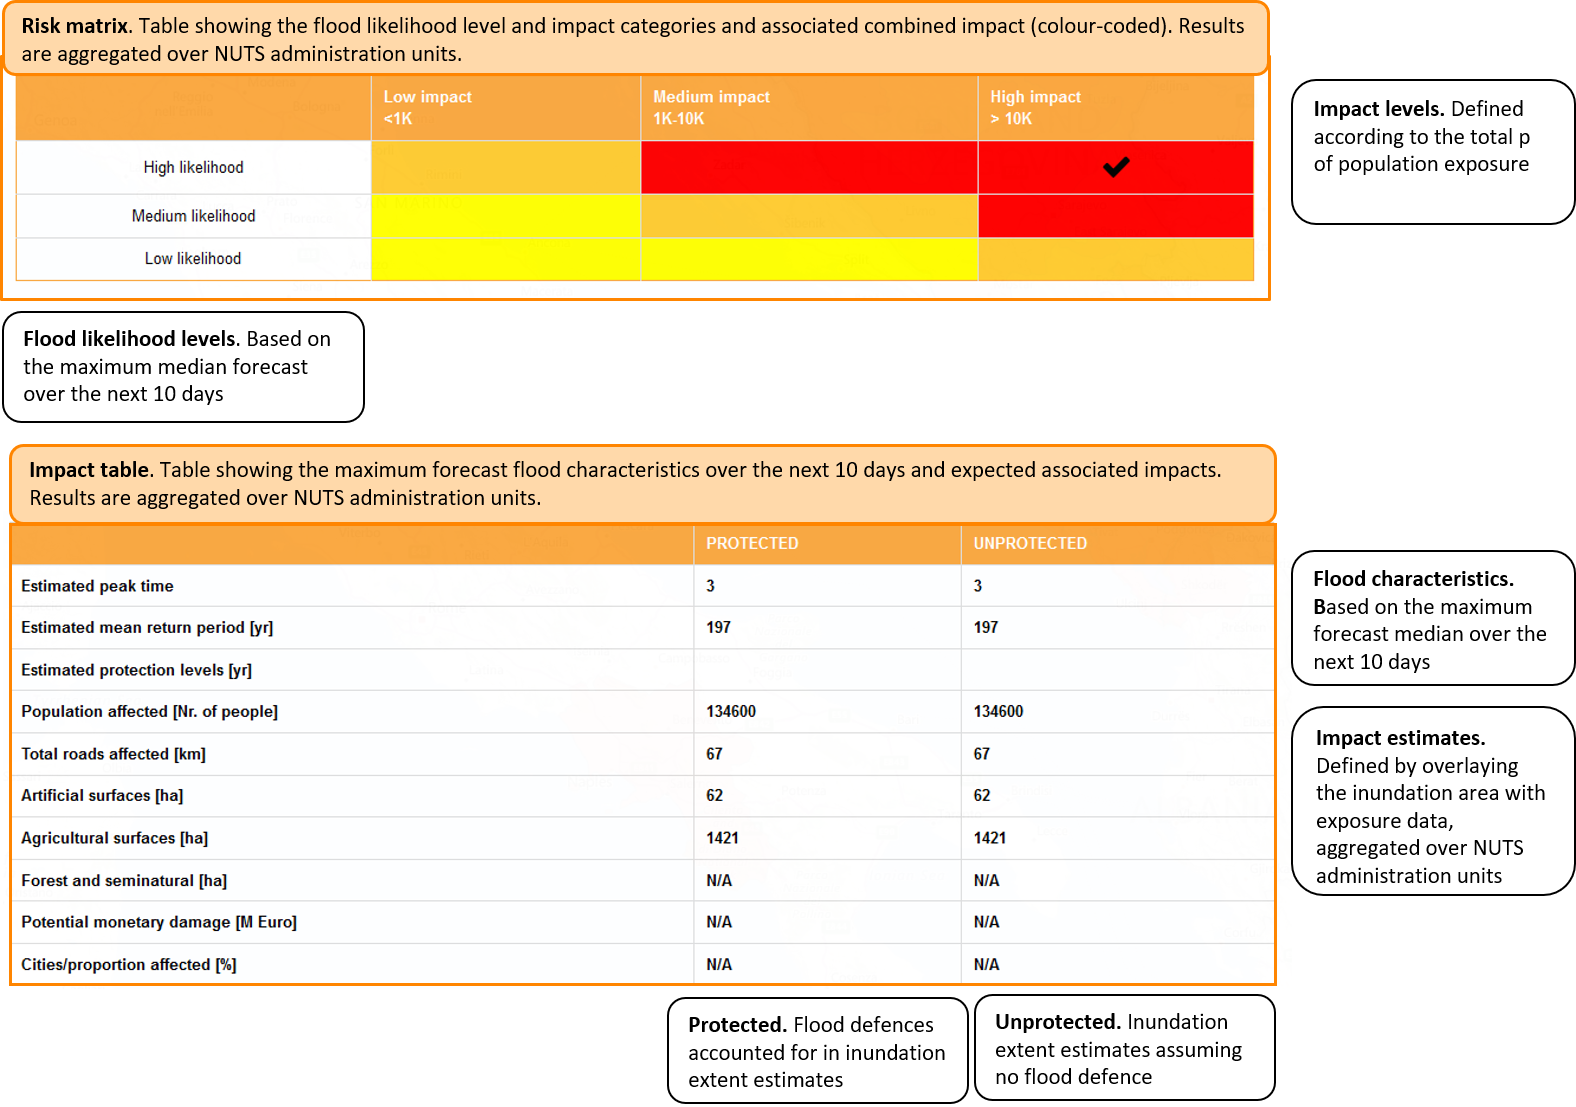
The data in the pop out table are sourced from the following datasets:
Population affected: Global Human Settlement Layer
Estimated protection levels: FLOPROS
Total roads affected: OpenStreetMap
Artificial/Agricultural surfaces and Forest and semi-natural: CORINE land cover for 2012