Flood impact forecasts are especially important in the preparedness phase, to support the planning and allocation of rescue assets, and to get a first estimate of the forecasted flood event’s potential socio-economic consequences.
In CEMS-Flood, the flood impact forecasts are based on three components: 1) medium-range flood forecasts, 2) event-based rapid flood mapping, and 3) impact assessment.
- Medium-range flood forecast: every time a flood event greater than the 10 year return period is forecasted in CEMS-Flood, the return period of the maximum discharge (based on the ECMWF-ENS ensemble forecast median and mean in GloFAS and EFAS respectively) over the entire forecast period (30 days in GloFAS, 10 days in EFAS) is computed in each grid cell (shown by the coarse cells in Fig. 1). These values do not consider the possible role of local flood defences, therefore they represent an unprotected scenario. A second scenario which considers flood defences is computed by comparing the forecasted return period values against estimated flood protection levels from FLOPROS (Scussolini et al., 2016). River grid cells where the protection levels are exceeded are selected and form the protected scenario.
- Rapid flood mapping: for each CEMS-Flood river section identified in step 1, flood prone areas are delineated, using a catalogue of flood hazard maps. The obtained event-based hazard map has a spatial resolution of XXX (up to GloFAS version 3, 0.000833 by 0.000833 degrees or approximately 90 by 90 m and up to EFAS version 4 XXX) and is shown on the “Rapid Flood Mapping” layer. The flood hazard maps catalogue is generated using the LISFLOOD-FP hydraulic model (CA2D hydraulic model for GloFAS until version 3).
- Impact assessment: the event-based hazard maps are combined with exposure information to assess regional impacts (shown on the “Rapid Impact Assessment” layer). Considered exposure includes population, infrastructure and land cover. The impact is calculated by combining the flood severity and probability with the exposed population. The result is summarised on administration units sourced from NUTS in Europe and GADM in the rest of the world.
The GloFAS flood impact forecasts are provided to the users as a set of dedicated layers described.
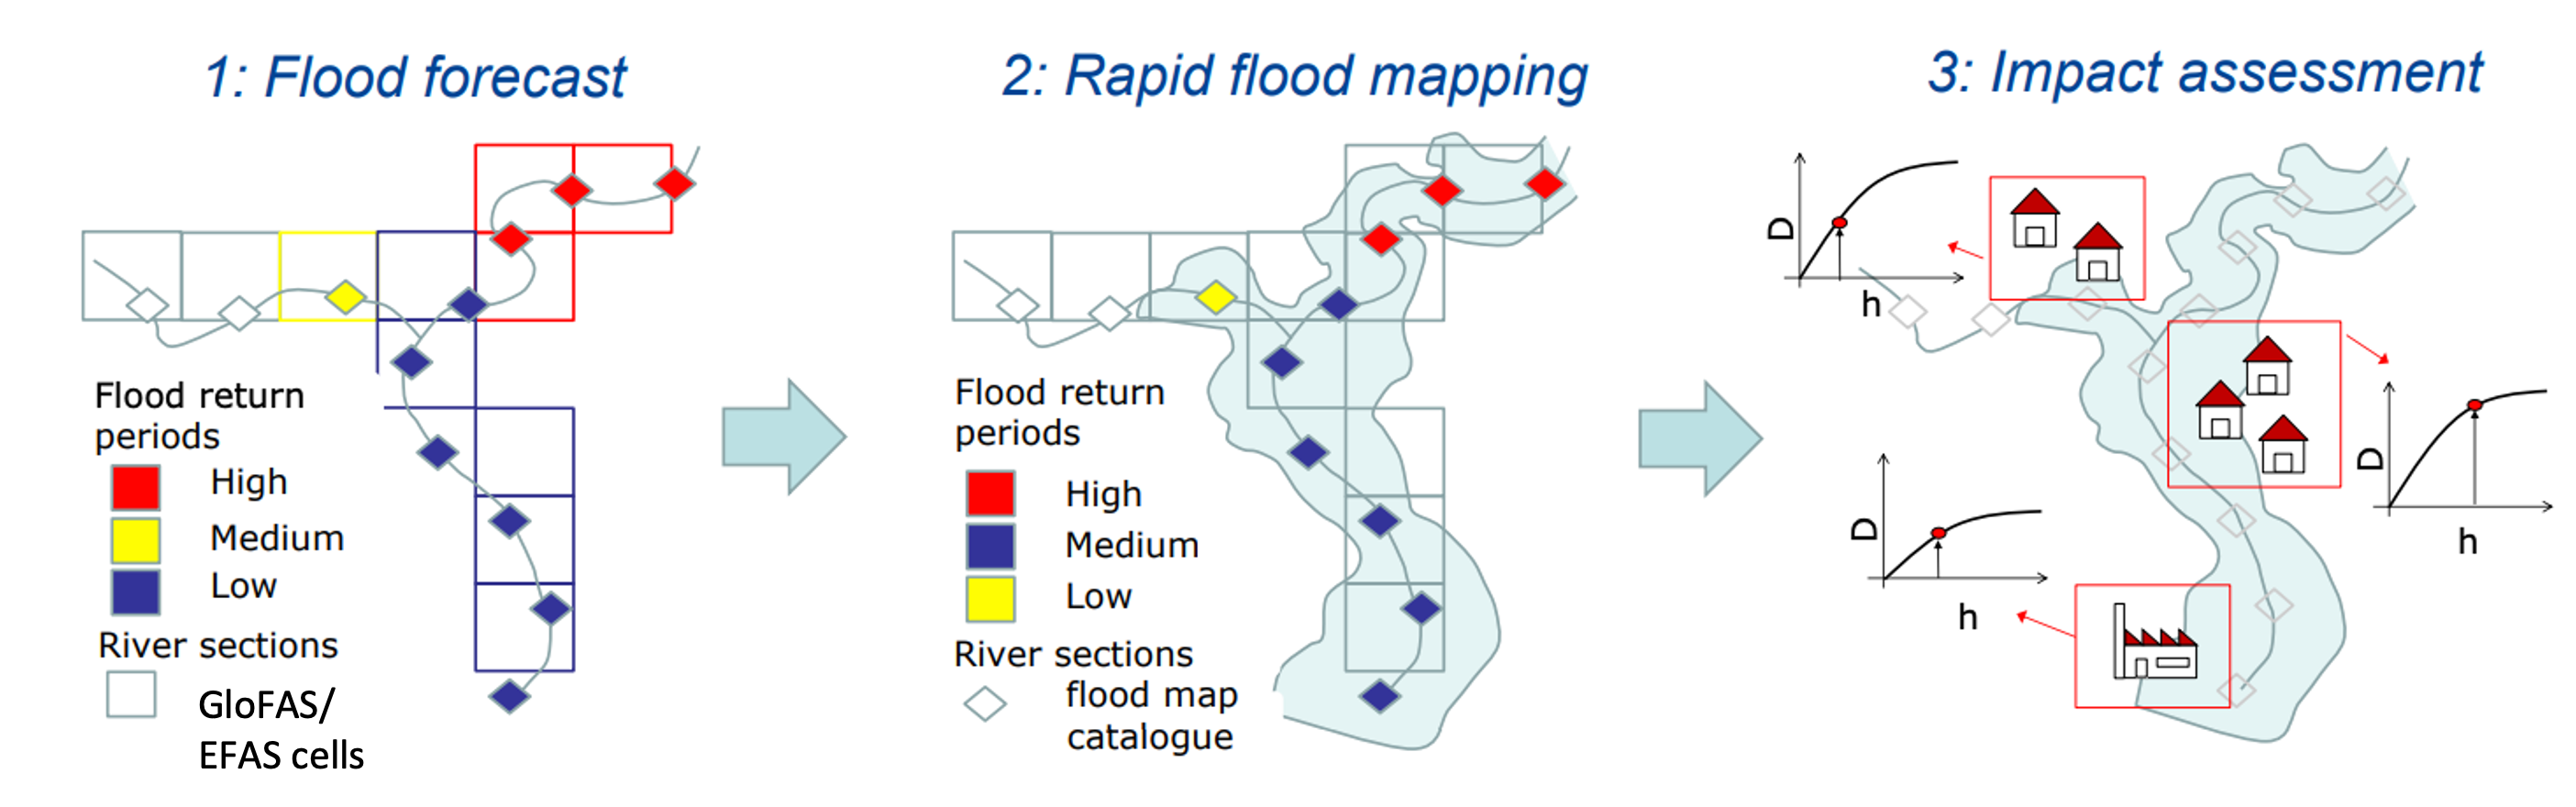
Figure 1. The three components to produce the GloFAS flood impact forecast products, adapted from Dottori et al., 2017.
v