-
Created by
 Joshua Talib, last updated on Oct 28, 2025
3 minute read
Joshua Talib, last updated on Oct 28, 2025
3 minute read
In addition to displaying global RPSSs on the AI Weather Quest website, we perform automated regional forecast evaluations to provide model developers with insights into areas where forecasts may be underperforming. The regional forecast evaluation webpage should update on day 37 of the forecast workflow, once the AI Weather Quest leaderboards have been published.
The following sections are organised by competitive period (e.g., SON 2025 and DJF 2025/2026). The same analysis is applied for each period. Please note, that these webpages represent a dynamic, continuously updated forecast evaluation. Content will change as new data and forecast initialisations become available.
Structure of regional forecast analysis pages
Introduction
Each page begins with an introduction that specifies the competitive period under review. It also highlights the forecast initializations used to compute the model evaluation.
Regional skill score files
Excel spreadsheets provide all regional skill scores for every submission to the AI Weather Quest, enabling detailed comparison of performance across regions.
Top 10 team tables
Tables summarise regional, variable-averaged RPSSs for the teams with the top 10 global, period-aggregated RPSSs. Scores are presented for two forecast windows: days 19–25 and days 26–32.
Aggregated RPSS figures
For the highest-performing model from the top 10 teams, figures show global maps of aggregated RPSSs for each variable and forecast window. Note that during the early stages of a competitive period, only a limited number of forecast initializations may be available to compute grid-point values.
Percentage of positive period-aggregated RPSSs
These figures display the total percentage of positive RPSS values, i.e. points where forecasts outperform climatology, for each submitted model. Percentages are calculated relative to the total number of valid grid points. For example, for near-surface temperature (tas), only grid points with more than 50% land cover are included in the calculation.
Defined analysis regions
Zonal Bands
The following zonal regions are used for large-scale evaluation of forecast performance:
| Region Name | Latitude Range | Colour (Map) |
|---|---|---|
| Tropics | 30°N – 30°S | Slate Gray |
| Northern Hemisphere Extratropics (NHem ExTro.) | 60°N – 30°N | Medium Aquamarine |
| Southern Hemisphere Extratropics (SHem ExTro.) | 30°S – 60°S | Steel Blue |
| Northern Polar Region (NHem Pol.) | 90°N – 60°N | Blue Violet |
| Southern Polar Region (Shem Pol.) | 60°S – 90°S | Purple |
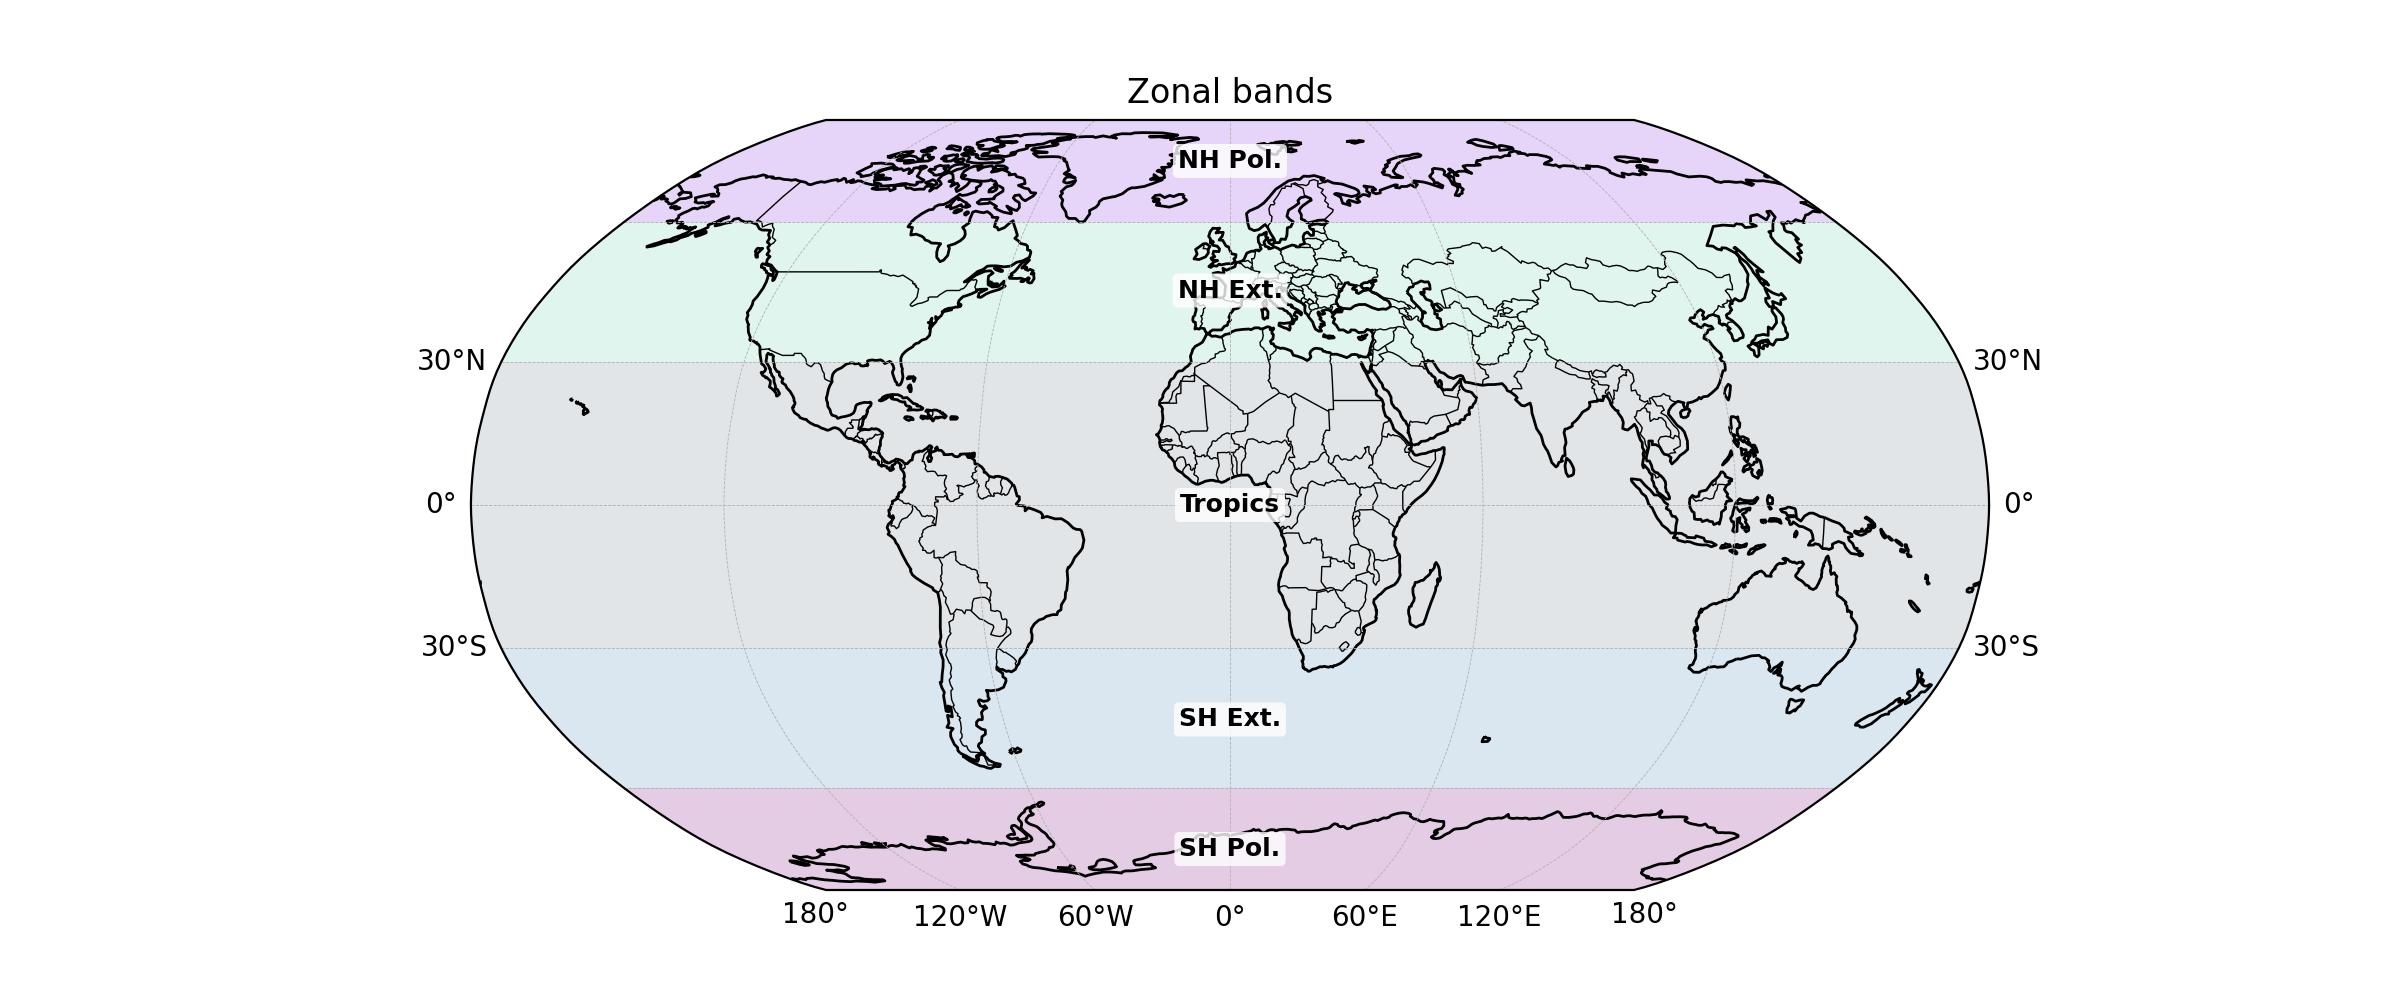
Figure 1: Zonal areas used to evaluate forecast skill.
Continental Regions
For more localized assessments, continental-scale regions are defined as follows:
| Region Name | Northern Boundary | Southern Boundary | Western Boundary | Eastern Boundary | Colour (Map) |
|---|---|---|---|---|---|
| North America (N. Amer) | 72°N | 15°N | 170°W | 50°W | Charcoal Gray |
| South America (S. Amer) | 15°N | 60°S | 85°W | 35°W | Medium Aquamarine |
| Europe | 72°N | 35°N | 25°W | 40°E | Steel Blue |
| Africa | 35°N | 35°S | 20°W | 55°E | Dark Blue |
| Asia | 80°N | 5°N | 40°E | 180°E | Blue Violet |
| Oceania | 5°N | 50°S | 90°E | 180°E | Purple |
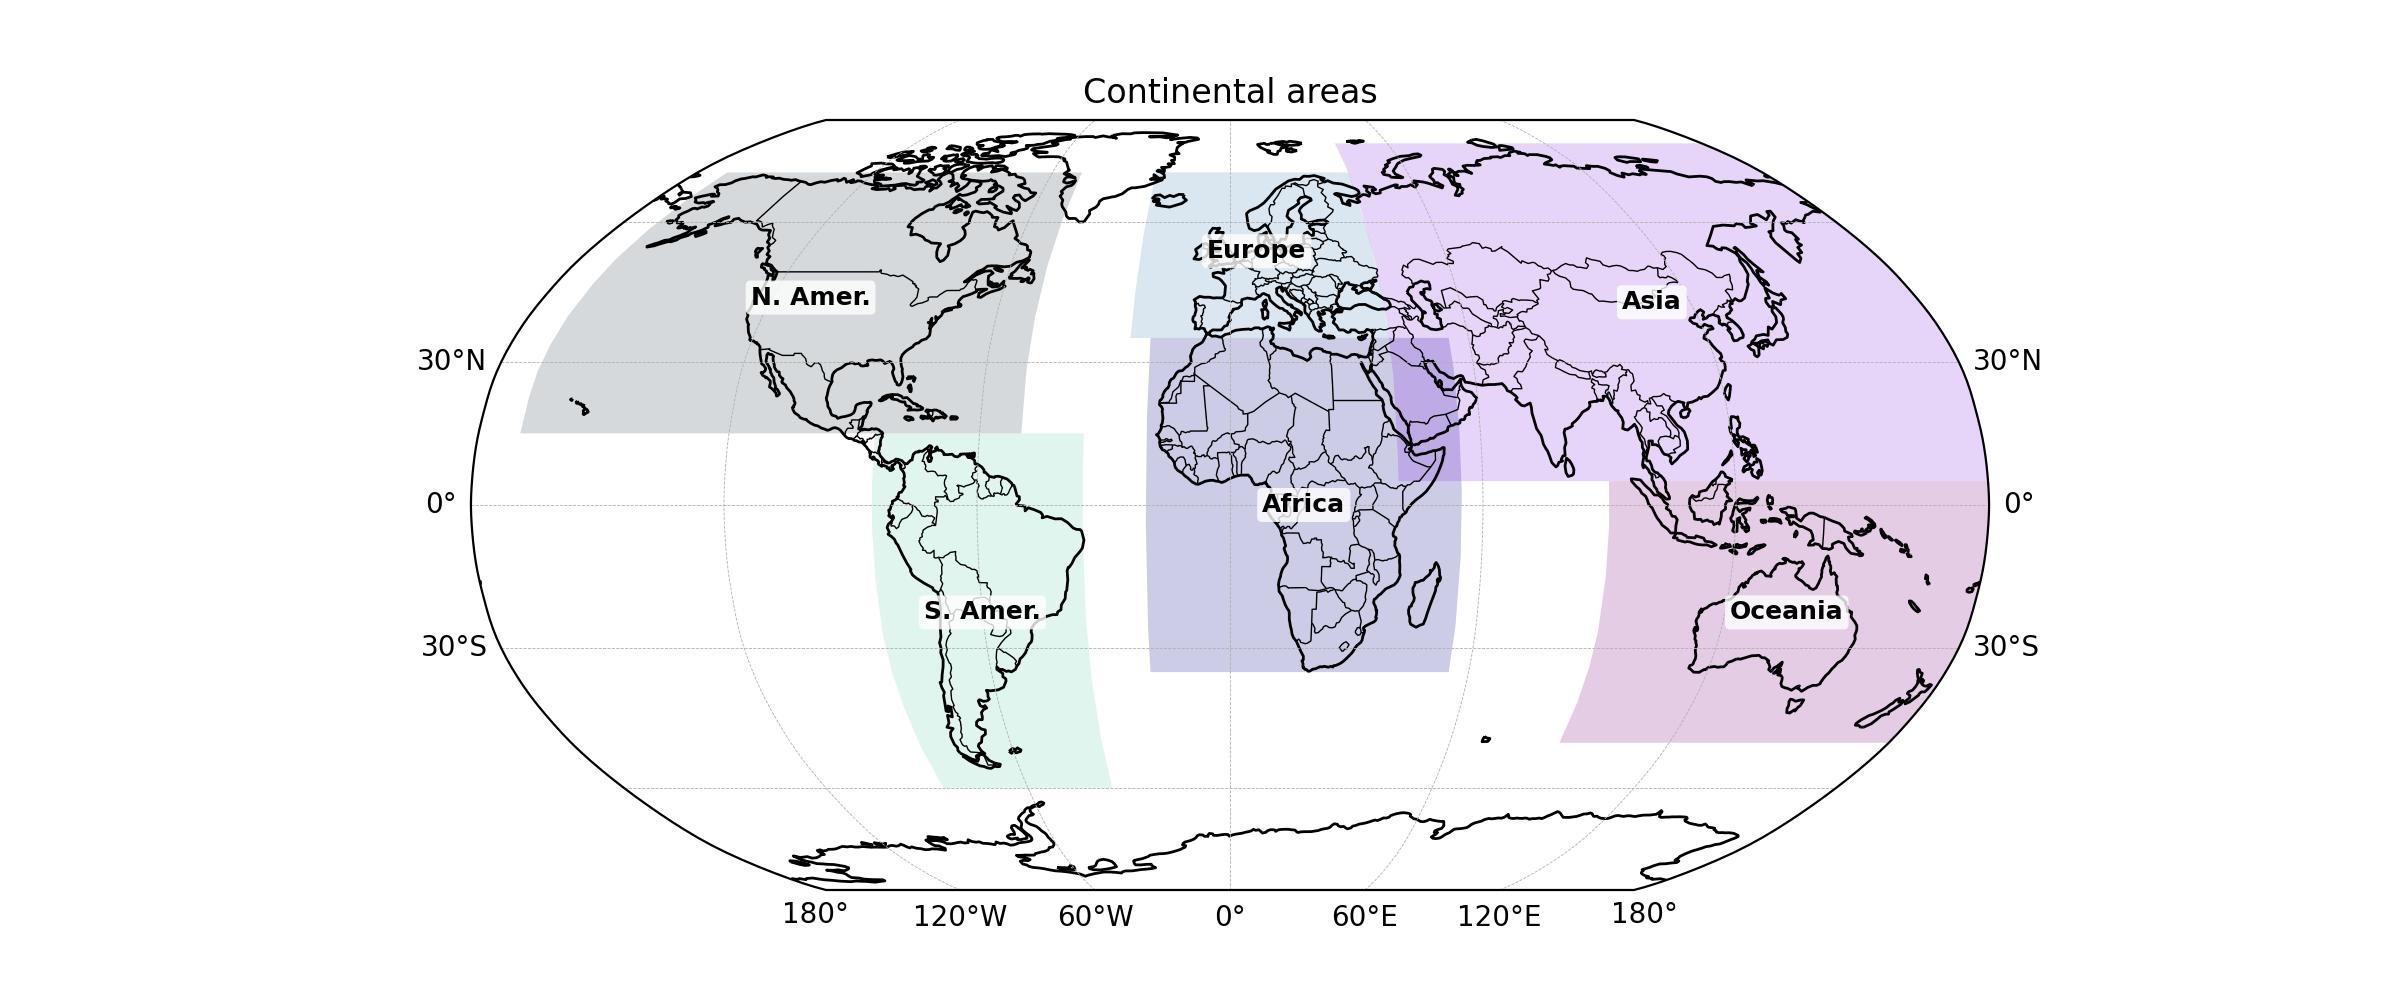
Figure 2: Continental areas used to evaluate forecast skill.