-
Created by
 Karen O'Regan, last updated on Mar 05, 2025
6 minute read
Karen O'Regan, last updated on Mar 05, 2025
6 minute read

 Flash Flood Products
| Product name | Description (established over forecast horizon) | Outputs | Forecasting horizon | Forecast Model (ensemble members) |
Short range | Drainage area affected by the forecasted heavy precipitation and potential flash floods. Yellow/Red/Purple = drainage area affected with a high probability to exceed a 2/5/20 year return period magnitude. | Map based on LISFLOOD river network | 5 days | COSMO (20) | |
Short range | Reporting points showing the furthest downstream locations where the forecasted probability (%) of extreme runoff accumulations exceeds a 2 (yellow), 5 (red), or 20 (purple) year return period magnitude. Enlarged triangles represent the most flash flood prone location within each administration unit where the forecasted probability is >= 10% of the 5 year return period and the lead time to the runoff peak is <= 60 hours. Persistence shows the number of prior forecasts, including the current one, where at least one reporting point in each administration region has a forecasted probability >=10% of the 5 year return period.
| Map based on flood probability signal Graph of ensemble hydrograph (in return period scale) for each reporting point | 5 days | COSMO (20) | |
Short range | The 90th percentile over each sub-catchment of the maximum gridded flash flood impact level forecasted between a lead time of 0-120 hours. Flash flood impact is based on flash flood hazard forecasts and exposure data. When a sub-catchment is clicked, a pop-up window displays further information about the potential exposure and the location of the forecasted event within the impact matrix. Precipitation accumulations forecasted for the upcoming 5 days. The product is displayed as a summary for four lead time aggregation windows: (0-6h), (7-24h), (25-48h), (49-120h). The precipitation accumulations have been obtained by seamless blending of radar-based ensemble nowcasts and precipitation forecasts of a NWP EPS (for the first 6 hours). For more information, see: Radar-based River Flash Flood Impact Catchment Summaries (0-120h)
| Map based on river basins | 5 days | ECMWF-ENS (51) Radar nowcast (20) | |
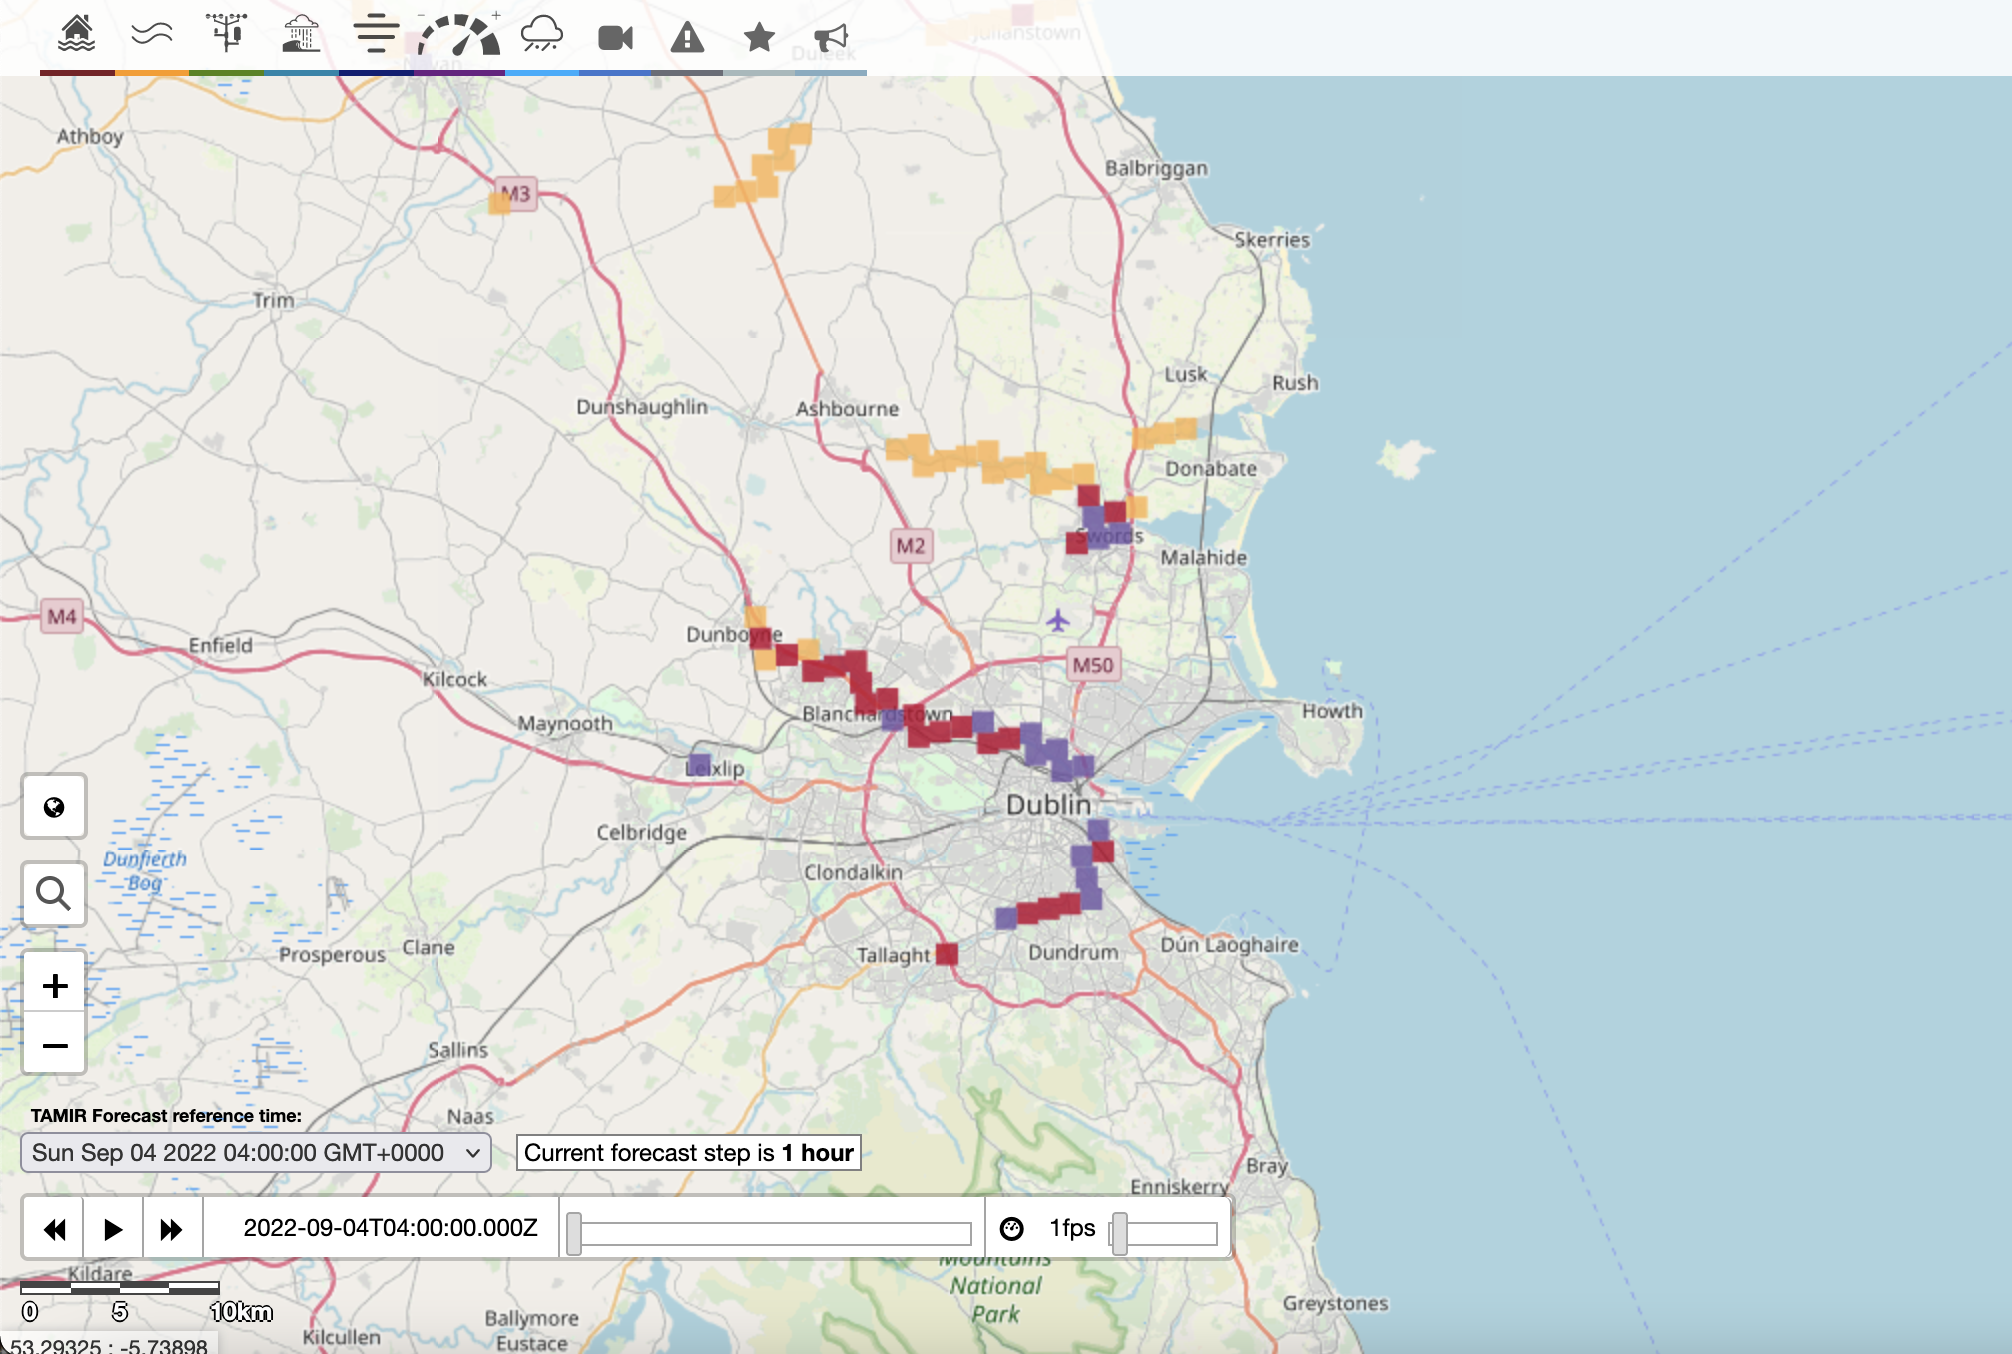
Short range | Animated hourly forecasts of flash flood impact levels over the river network for the next 6 hours, then 6 hourly forecasts until a leadtime of 120 hours. During each timestep each grid cell is shaded according to the combination of the flash flood hazard forecast at that timestep and static exposure data on an impact matrix.
| Map based on LISFLOOD river network (animation) | 5 days | ECMWF-ENS (51) Radar nowcast (20) | |
Short range | Highlights the hourly risk of flash flooding in ~1 km urban grid cells over the next 6 hours. It is generated from nowcasts produced from rainfall observed by the OPERA radar network. Grid cells where urban flash flooding is possible are classed as having low (yellow), medium (orange), or red (high) hazard level. For more information, see: Radar-based Urban Flash Flood Hazard forecasts
| Map highlighting 1-km urban grid cells at risk of flash flooding | 5 hours | Radar nowcast (1) | |
Short range | Shows ellipses where there is a risk of flash flood hazard due to intense precipitation over the next 3 hours. Ellipses are defined where the backscatter value in the OPERA radar observation is greater than 35 dBZ, indicating a risk of intense precipitation. Ellipses are shaded according to the potential hazard level estimated using a machine learning model trained on impact observations. The ellipses fade out with increasing lead time to represent the increasing forecast uncertainty in the location of the affected area. For more information see: Radar-based Intense Precipitation Hazard Forecasts
| Map showing ellipses defining locations of storm cells, shading relates to possible impact level | 3 hours | Radar nowcast (1) | |
Short range | Displays the area covered by the OPERA pan-European radar network data for a specific forecast of interest. For more detailed information, see: Radar Coverage
| Map based on smoothed LISFLOOD grid information | 0 hours (observation) | Radar observations | |
Short range | This layer shows the 24 hour accumulated precipitation as estimated from gauge-adjusted OPERA radar composites from the pan-European OPERA radar rainfall network blended with short range precipitation forecasted by the ECMWF ensemble. This layer is generated at 00 and 12 UTC every day, the values refer to the total accumulated precipitation in the preceding 24 hours.
| Map based on smoothed LISFLOOD grid information | 24 hours | ECMWF-ENS (control member) Radar observation | |
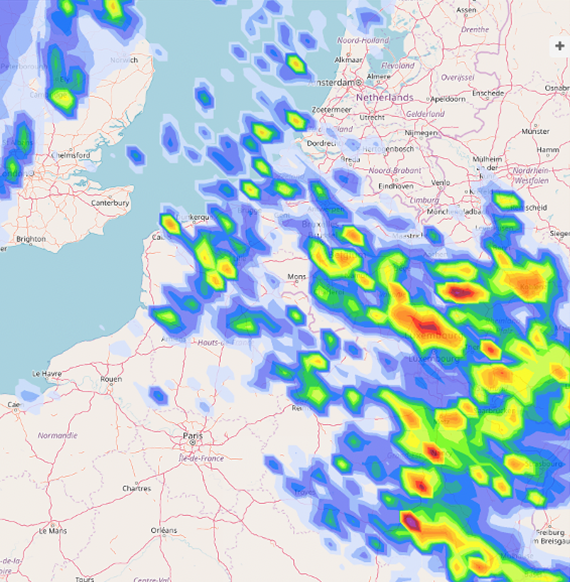
Short range | Animated precipitation accumulations forecasted up to 120 hours ahead obtained by seamless blending of radar-based ensemble nowcasts and precipitation forecasts from the ECMWF ensemble. The displayed accumulations correspond to the 80th percentile of the ensemble forecast. For the first few hours of the forecast, the timestep is 1 hour, thereafter the timestep is 6 hours, the timestep is specified in a box above the animation time slider.
| Map based on smoothed LISFLOOD grid information | 5 days | ECMWF-ENS (51) Radar nowcast (20) | |
ERICHA - FF hazard levels forecasts ERICHA Flash Flood Nowcasting products have been retired since EFAS v5.1 (2024-03-21) and replaced with TAMIR Products | Using the gauge-adjusted precipitation estimates and nowcasts, the flash flood hazard level is estimated by first computing the upstream basin-aggregated rainfall over the drainage network (resolution: 1km) and then comparing the observed values with a set of reference thresholds to determine the flash flood hazard level (yellow - low; orange - medium; red - high). The ERICHA FF hazard level is displayed in a loop with 15-minute time interval. It shows the estimated flash flood hazard level for several hours in the past up to current time and nowcasts up to 6 hours (when the loop bar turns red). This product was developed in the ERICHA project.
| Map based on 1-km river network | 6 hours | NOWCAST (1) | |
| ERICHA Flash Flood Nowcasting products have been retired since EFAS v5.1 (2024-03-21) and replaced with TAMIR Products | Daily gauge-adjusted radar rainfall accumulation from OPERA is estimated for the last 24 hours finishing at the selected time stamp (00:00, 12:00 UTC). In EFAS this product is only available for the past 7 days. This product was developed in the ERICHA project.
| Map based on OPERA 2-km grid information | NOWCAST (1) | |
| ERICHA hourly accumulated precipitation ERICHA Flash Flood Nowcasting products have been retired since EFAS v5.1 (2024-03-21) and replaced with TAMIR Products | 1-h precipitation accumulation estimated from the European OPERA radar rainfall composites. This product is displayed in a loop with 15-minute time interval. It shows the estimated precipitation for several hours in the past up to current time and nowcasts (when the loop bar turns red) up to 6 hours. Deterministic precipitation nowcasts are generated by Lagrangian extrapolation. This product was developed in the ERICHA project. Recently, a multiplicative adjustment factor map (retrieved from long-term comparison with rain gauge observations) is applied to compensate for systematic biases in the original OPERA radar rainfall estimates. The gauge-adjustment module has been developed within the SMUFF project.
| Map based on OPERA 2-km grid information Animated maps (15 min only) | Every 15min up to 6 hours | NOWCAST (1) |