-
Created by
 Michela Giusti, last updated on Jul 02, 2026
13 minute read
Michela Giusti, last updated on Jul 02, 2026
13 minute read
Documentation in this section is provided as is. The dataset, the documentation below relates to, is no longer supported and will be removed from the Climate Data Store (CDS) at a later date.
Contributors: Toon Haer (VU), Janet Wijngaard (KNMI), Alan Whitelaw (CGI)
Issued by: Toon Haer (VU)
Issued Date: 02/06/2021
Ref: C3S_D435LOT3.KNMI.3.1.1A_202103_updated documentation_for_CDS_v1.1
Official refence number service contract: 2020/C3S_435_Lot3_KNMI
Acronyms
1. Introduction
1.1. Executive Summary
The Tier 3 indicators, described as such because they describe socio-economic impacts of the storms, are risk and loss indicators. These indicators have been built up using open-source information, with OpenStreetMap building level data as a basis. Each building is associated with a land cover type, a building type and related to these, a reconstruction type. Fragility curves, also from the public domain, are then applied to link the building type to the impact of the storm severity. This information is mapped to the NUTS3 statistical regions associated with the buildings and presented in these NUTS3 categories. Losses are tabulated per storm. As a Tier 3 indicator, the Loss indicator complements the other C3S Windstorm products as it describes the socio-economic impacts of windstorms within Europe. These loss indicators combine original and modelled climate data with additional geospatial and socio-economic information in a way that allows their use by the insurance sector. The loss indicator is complementary to the C3S windstorm risk data which provides an estimation of the potential losses that would occur within a particular location within a typical year. To aid comparison both the loss and risk data is presented in the same format.
1.2. Scope of Documentation
This document describes the C3S Tier 3 loss indicators using the standard C3S format for product descriptions, i.e., in terms of product target requirements, product overview, input data and method. It is based on the earlier C3S proof of concept contract (WISC) documents, particularly C3S_D426LOT2.KNMI.2.3.6_201911_loss_indicator_ description_V1.0 produced by Toon Haer on 28- 11-2019. The approach is further described in peer-reviewed publication (Koks & Haer, 2020).
1.3. Version History
Preceding the operational stage of the Windstorm Service for the Insurance sector, the pre- operational stage WISC1 successfully demonstrated the estimation of economic losses for winter storm events over Europe, based on state-of-the-art numerical weather prediction models and economic loss models. The service applies a chain of models, from models to generate Tier 1 windstorm footprints to an economic model for estimating Tier 3 economic losses, where the latter uses the windstorm footprints as input. In the pre-operational stage the Tier 1 footprints were dynamically downscaled by the UK Met Office (UKMO) Unified mesoscale model based on the ERA- Interim and ERA-20C reanalysis datasets. As this model is not freely available therefore a different approach to develop Tier 1 windstorms was developed by KNMI. This new approach uses the new ERA5 wind fields, instead of the older ERA-interim wind fields, and applies a statistical downscaling using multiple linear regression (STATDOWN) approach described in van den Brink & Whan (2018). In the remainder of the user guide we will refer to the new footprints as STATDOWN footprints, and to the footprints from the pre-operational stage as WISC footprints.
2. Product Description
2.1. Product Target Requirements
Extreme wind events are among the costliest natural disasters in Europe, causing severe damages every year. For damage estimates, the community mostly relies on post-disaster data, which is often not publicly available. Few approaches offer more generic tools, but again these are often based on non-disclosed data. To offer a generic, high-resolution, reproducible, and publicly accessible tool, this dataset presents an estimate from a wind damage model that is built around publicly available hazard, exposure, and vulnerability data. The model is used to provide the current dataset that assesses building damages related to extratropical storms in Europe, but the methodology is applicable globally, given data availability, and to other hazards for which similar risk frameworks can be applied. The model is distributed as an open-source model to offer a transparent and useable windstorm damage model to a broad audience, and the dataset is provided through the Climate Data Store (CDS).
2.2. Product Overview
2.2.1. Data Description
Table 1: Overview of key characteristics of the Tier 3 windstorm loss indicators
|
Data Description |
|
|
Dataset title |
Tier 3 windstorm loss indicators |
|
Data type |
Loss indicators |
|
Topic category |
Natural risk zones |
|
Sector |
Insurance |
|
Keyword |
Windstorm losses |
|
Dataset language |
English |
|
Domain |
Europe, for 21 countries (Austria, Belgium, Czech Republic, Denmark, Estonia, Spain, Finland, France, Great Britain, Germany, Ireland, Italy, Lithuania, Luxembourg, Latvia, Netherlands, Norway, Poland, Portugal, Sweden, Switzerland)
|
|
Horizontal resolution |
Each file covers a single NUTS3 region (Nomenclature of Territorial Units for Statistics). Within each file individual rows cover the building footprint, |
|
Temporal coverage |
1979-01-01/to/2020-01-01 |
|
Temporal resolution |
Loss values represent the loss recorded for a particular storm event |
|
Vertical coverage |
Single level |
|
Update frequency |
None (static dataset) |
|
Version |
n/a |
|
Model |
high-resolution wind damage model for Europe |
|
Experiment |
n/a |
|
Terms of Use |
OpenStreetMaps Data made available through the Open Data Commons Open Database License (ODbL) was used in development of the Tier 3 Loss and Risk indicators. Therefore, works produced from it (OpenStreetMap), need to use the Open Database License (ODbL) |
2.2.2. Variable Description
Table 2: Overview and description of variables.
|
Variables |
|||
|
Long Name |
Short Name |
Unit |
Description |
|
Building |
Building |
String |
Type of building according to OSM. Varies from only "yes" it is a building, to the actual |
|
IDENTIFIER |
ID_ |
integer |
Country / NUTS3 region / building based reference number (applied to risk and to loss). Buildings are numbered sequentially within each country / NUTS3 region |
|
COUNTRY |
COUNTRY |
String |
The country in which the building is located |
|
LATITUDE |
LAT |
Float16 |
Latitude of the centroid of the building |
|
LONGITUDE |
LONG |
Float16 |
Longitude of the centroid of the building |
|
LANDUSE CLASS |
CLC_2012 |
integer |
Land-use code corresponding to the Corine Land Cover classification |
|
AREA |
AREA_m2 |
Float16 |
Area of the building footprint |
|
Date |
Date |
MM/DD/YYYY |
Loss estimate per storm per building |
|
Loss estimates |
Loss |
USD ($) |
Financial loss at each building location due to a particular storm event. |
|
Loss estimates aggregated to country (NUTS 1) level for all |
NUTS1 loss |
USD ($) |
Summary file in .csv format on country level (NUTS1). |
|
Loss estimates aggregated to NUTS 3 level for all storms |
NUTS3 loss |
USD ($) |
Summary file in .csv format on NUTS3 level |
|
Loss estimates aggregated to SECTOR level for |
SECTOR loss |
USD ($) |
Summary file in .csv format for different sectors; agriculture, industry, residential, transport, and other. |
2.3. Input Data
Table 3: Overview of climate model data for input to Tier 3 windstorm loss indicators, summarizing the model properties and available scenario simulations.
|
Input Data |
||||
|
Model name |
Model centre |
Scenario |
Period |
Resolution |
|
OpenStreetMaps |
© OpenStreetMap- |
n/a |
n/a |
Building level |
|
CORINE |
Copernicus Land |
n/a |
ClC 2012 |
30" |
|
PAGER |
U.S. geological service |
n/a |
n/a |
n/a |
|
Storm footprints |
Climate Data Store |
n/a |
1979-2020 |
0.04° |
2.3.1. OpenStreetMaps (OSM)
All building footprint data are extracted from OSM, which has proven to be the most extensive dataset of publicly available building footprints for Europe. OpenStreetMap is a free, editable map of the whole world that is being built by volunteers largely from scratch and released with an open- content license. The OpenStreetMap License allows free (or almost free) access to our map images and all of our underlying map data. As OSM is user driven, it continuously evolves and improves, improving the building footprint coverage across Europe.
2.3.2. CORINE
CORINE is developed by the European Environmental Agency and distinguishes between 45 different land use classes, with a known percentage of residential, commercial, industrial, and other land use- classes. This CORINE dataset is used to classify OSM buildings into different sectoral landuse classes; agriculture, residential, commercial/industrial, and transport.
2.3.3. PAGER
PAGER, a US Geological Survey project, stands for the Prompt Assessment of Global Earthquakes for Response. Overall it is an automated system that takes in seismic data from remote sensors to estimate earthquake shaking and the scope and impact of earthquakes around the world. As part of this, PAGER links with the World Housing Encyclopedia to produce a global database of building stocks. While this is designed to assess vulnerability to earthquake shaking, the construction type information also provides characteristics that can be used directly to assess windstorm vulnerability.
2.3.4. Storm footprints
The storm footprints are based on statistical downscaling (STATDOWN) of the ERA5 dataset, using the main high resolution ERA5 field in each case. The operational footprints are derived from the new ERA5 storm tracks produced for the operational service.
2.4. Method
2.4.1. Background
The building level loss estimates are calculated using a conventional risk modelling framework (Fig. 1), where we define risk as a function of hazard – the probability and strength of an event with potential to cause harm; exposure – the value of assets subject to the hazard; and vulnerability – the susceptibility of the asset to hazards of a given severity. An overview of the modelling approach is show in Figure 1 and further described in 2.4.2.
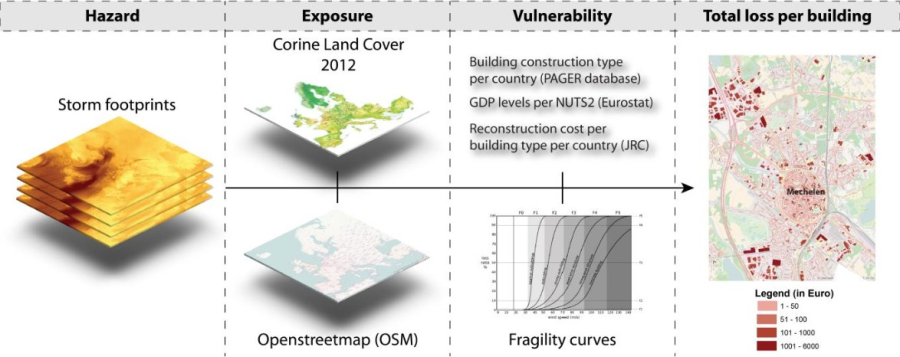
Figure 1: Overview of the various steps for the loss estimations (Koks, Tiggeloven, et al., 2017)
2.4.2. Model / Algorithm
Hazard – To enable loss estimates, the storm footprints generated as netcdf format in WISC and STATDOWN are translated to geotiffs and reprojected to the ETR89 coordinate system (EPSG:3035), a similar coordinate system as the Corine Land Cover dataset (CORINE) (EEA, 2014). This provides geotiffs with wind speed information per grid cell, which can be overlaid with the exposure maps. Technical details of the STATDOWN (van den Brink and Whan, 2018).
Exposure - The exposure maps are generated by combining CORINE and Openstreetmap (OSM) data. OSM data provides building footprints which can be extracted to shapefiles. While the OSM data provides good coverage for most countries, there might still be buildings missing for others. Despite this limitation, the OSM database offers the most consistent and extensive building dataset for Europe. Since the OSM database is constantly being updated, the model always extracts the most up- to-date OSM data. The OSM data is combined with CORINE to categorize buildings per sector. CORINE is developed by the European Environmental Agency and distinguishes between 45 different landuse classes, with a known percentage of residential, commercial, industrial, and other landuse-classes. This CORINE dataset is used to classify OSM buildings into different sectoral landuse classes; agriculture, residential, commercial/industrial, and transport. Figure 2 shows in further detail how the exposure maps are created, and how they are used to assess losses by using vulnerability data.
Vulnerability – The vulnerability is described as the susceptibility of an exposed asset to the hazard. This susceptibility is captured in so-called fragility curves, that show the relation between a certain wind speed, and the percentage damage done to an asset which in this case are buildings. We use the windstorm fragility curves by Feuerstein et al. (2011), which distinguishes between different building construction types: (I) weak outbuildings, (II) outbuilding, (III) strong outbuilding, (IV) weak brick structure, (V) strong brick structure, (VI) concrete building. When the fragility curve is combined with an estimated value of reconstruction costs, it can be translated in a vulnerability curve, which describes the damage done to a building at a certain wind speed. For this model, the reconstruction costs are taken from a study by Huizinga and De Moel (Huizinga et al., 2017). These values are corrected for each country following the differences in GDP and corrected for regionally by the difference between national GDP and regional GDP. The OSM database used for extracting exposed building footprints does not provide information on different building construction types.
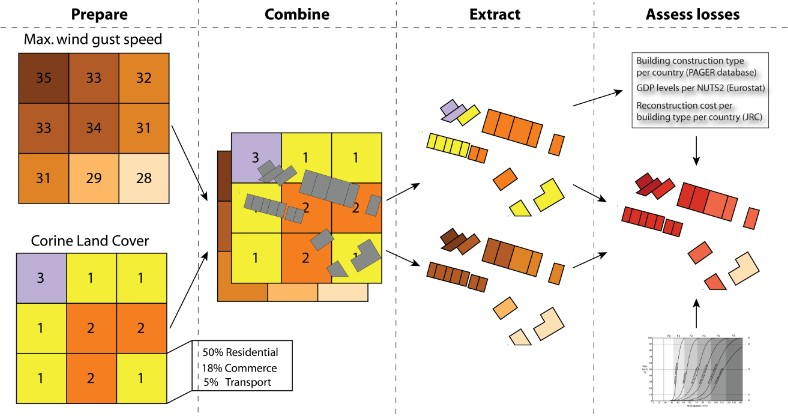
Figure 2: Example of loss calculation. Source: (Koks, Tiggeloven, et al., 2017)
To be able to distinguish between construction types for different countries, we use the PAGER database. The PAGER database defines 106 different building types for each country, which are aggregated to the 6 different building types considering in Feuerstein et al. (2011). Most of the European buildings fall into the latter two categories. Using the PAGER database, we obtain the share of each of the building types within a country (for example, 5% weak outbuildings, 30% strong brick structure, and 65% concrete building). The hazard, exposure, and vulnerability data is overlaid to obtain loss estimates. Loss estimates are made for each building footprints, for each vulnerability curve for different building construction type and multiplied by its relative share within the country. The loss estimates are aggregated for each NUTS3 region, for each country, and for each sector.
2.4.3. Validation
A full description of the sensitivity analysis (SA) is described in Koks & Haer (2020). We provide a summary here for the SA. The SA is performed in a Monte Carlo modelling framework following Crosetto et al. (2000) and Helton (1993). to investigate uncertainty and sensitivity related to the parameters. The following steps are performed: (1) assigning distributions to input parameters, (2) generating samples of different combinations of input parameters, (3) evaluating the model using the generated combinations of input parameters, and (4) analysing the results for uncertainty and sensitivity. Using SAlib, a publicly available Python library (Hermann, 2017), we perform a Delta Moment-Independent Measure (DMIM) analysis, as developed by Borgonovo (2007) and Plischke et al. (2013). This type of sensitivity analysis can be interpreted as a global sensitivity indicator which looks at the influence of input uncertainty on the entire output distribution without reference to a specific moment of the output (moment independence) and which can be defined also in the presence of correlations among the parameters. In total, we set up a set of 5000 different combinations of parameter values, focusing on the fragility curves. The sensitivity analysis shows that for each country/storm combination, the fragility curves are the most important driver of the results.
Validation of the loss estimates is done in comparison to publicly available storm loss estimates. Unfortunately, this could only be done on aggregated values, as high-resolution data is unavailable or undisclosed. The losses calculated here have been compared with the outcomes of four different vendor models (Air, IF, RMS and CoreLogic, presented in Waisman, 2015) and losses observed from a series of high impact storms reported in the XWS catalogue (Roberts et al., 2014). As the XWS catalogue provides insured losses only, actual total losses will be higher. Note that northwestern Europe has in general a better insurance coverage rate for storm losses than central and eastern Europe, and therefore the insured losses will more closely represent total losses for storm that pass over western-northwestern Europe. We compare the results from the proof-of-concept phase (WISC) with the current product using STATDOWN, with the vendor models and the observed losses see Figure 3. In general, the results stay within a realistic range of the recorded losses. Overall, the performance is quite reasonable compared to the storms for which the XWS catalogue does report losses. The service offers a valuable tool, using open-source data, to estimate losses from windstorms. Additional validation data could help to further improve the validation of the estimates.
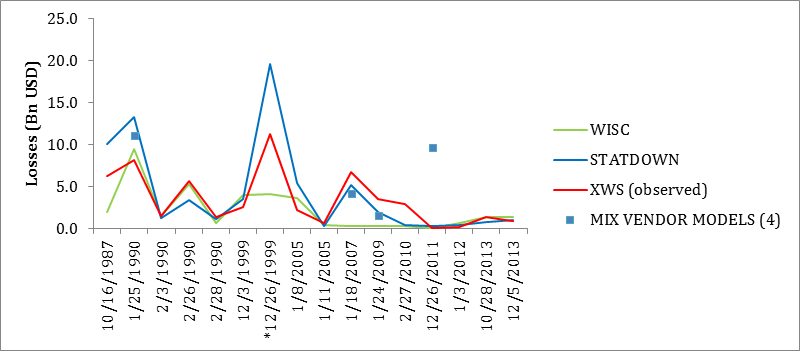
Figure 3: Loss estimates from the proof-of-concept phase (WISC), the current product using STATDOWN, in comparison with the vendor models and the observed losses.
3. Concluding Remarks
This dataset is build using a high-resolution damage model to estimate the damages to buildings due to extratropical windstorms in Europe. The approach provides flexibility in the derivation by developing the vulnerability curves from building level upwards. The approach is particularly valuable to support insurers' and academic assessments for post-disaster quick-scans and estimates of potential wind damage towards the future, allowing them to use an open-source and transparent approach. While we demonstrate the methodology on a continental scale, it is not bound by a geographic region, and thus can be applied globally provided that data is available.
References
Borgonovo, E. (2007) A new uncertainty importance measure. Reliab. Eng. Syst. Saf. 92, 771–784.
Crosetto, M., Tarantola, S. & Saltelli, A. (2000) Sensitivity and uncertainty analysis in spatial modelling based on GIS. Agric. Ecosyst. Environ. 81, 71–79.
EEA. CORINE Land Cover 2012 (2014). Copenhagen, Denmark: European Environmental Agency.
Helton, J. C. (1993) Uncertainty and sensitivity analysis techniques for use in performance assessment for radioactive waste disposal. Reliab. Eng. Syst. Saf. 42, 327–367.
Herman, J. & Usher, W. (2017) SALib: an open-source Python library for sensitivity analysis. J. Open Source Softw. 2.
Huizinga, J., de Moel, H., Szewczyk, W. & others (2017). Global flood depth-damage functions: Methodology and the database with guidelines.
Koks, E. E., & Haer, T. (2020). A high-resolution wind damage model for Europe. Scientific Reports. +https://doi.org/10.1038/s41598-020-63580-w+![]()
Plischke, E., Borgonovo, E. & Smith, C. L. (2013) Global sensitivity measures from given data. Eur. J. Oper. Res. 226, 536–550.
Roberts, J. F. et al. (2014) The XWS open access catalogue of extreme European windstorms from 1979 to 2012. Nat. Hazards Earth Syst. Sci.14, 2487–2501.
van den Brink, H., & Whan, K. (2018). Storm footprint generation through statistical downscaling. Report for the Copernicus Climate Change Service (C3S). Reference Number C3S_D426_LOT2_KNMI_1.1.1_201812.
Waisman, F. (2015) European windstorm vendor model comparison. in Slides of a presentation at IUA catastrophe risk management conference, London 30
