-
Created by
 Linus Magnusson on Feb 22, 2023
4 minute read
Linus Magnusson on Feb 22, 2023
4 minute read
Status:Ongoing analysis Material from: Linus
1. Impact
On 17 February the windstorm Otto hit Scotland and southern Scandinavia with travel disruptions in e.g Copenhagen.
2. Description of the event
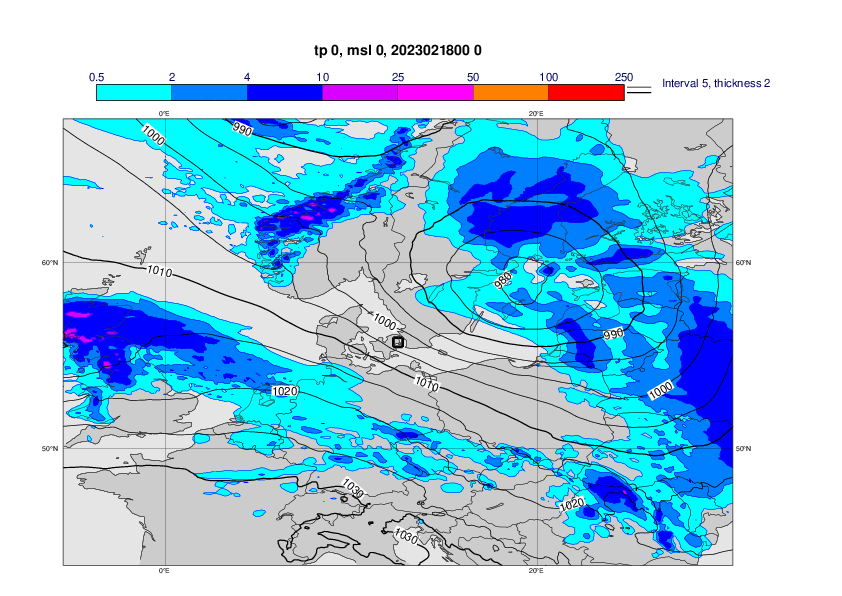
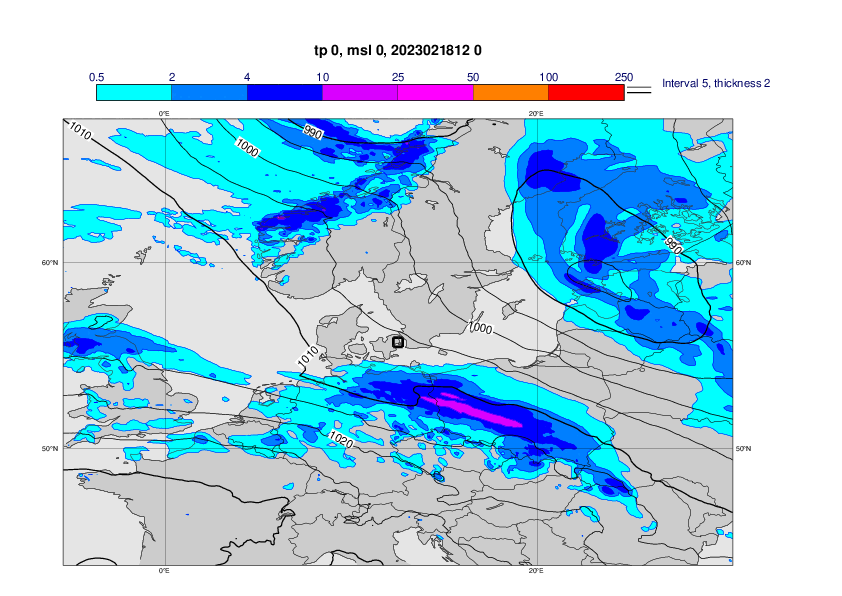
The plots below show analyses of MSLP and 6 hour rainfall from 17 February 00UTC to 18 February 12UTC, every 12th hour.


3. Predictability
3.1 Data assimilation
3.2 HRES
The plots below show observations from SYNOP (first plot), concatenated 6-hour forecasts (2nd plot) and o-suite HRES forecasts of 24-hour maximum wind gusts from 17 February 12UTC - 18 February 12UTC, from different initial dates.


The plots below show observations from SYNOP (first plot), concatenated 6-hour forecasts (2nd plot) and e-suite HRES forecasts of 24-hour maximum wind gusts from 17February 12UTC - 18 February 12UTC, from different initial dates.


3.3 ENS
The plots below show EFI for 1-day maximum wind gusts on 17 February (note the 12 hour shift from the other plots), from different initial times.


The plot below shows the forecast evolution plot for 24-hour maximum valid 17 February 12UTC - 18 February 12UTC for 0.5 degree box around Copenhagen. Mean of observations - green hourglass, concatenated 6-hour forecasts - green dot, HRES –red, ENS blue box-and-whisker, Model climate – red box-and-whisker. Ensemble median as black box and ensemble mean as black diamonds. Triangle marks the maximum in the model climate based on 1200 forecasts. 48r1 e-suite is included in orange dot (HRES/ENS control) and cyan (ENS distribution).
