![]() mcont ( macro/python ) pcont ( fortran )
mcont ( macro/python ) pcont ( fortran )
Contouring is achieved by calling the action routine pcont, i.e. call pcont . The call may be preceded by one or more calls to Magics parameter setting routines. pcont will only take into account those parameters set before the routine is called. Any calls to Magics parameter setting routines after pcont is called are only relevant to future action routines.
When the action routine pcont is called, it will plot contours based on the input data supplied and according to the user's instructions. The input data may have different organizations: GRIB code data, regular latitude/longitude grid, gaussian grid. Before pcont is called, the user must define how he wants the data to be contoured, i.e. location of the data, dimensions of the array, input field organization etc. This is done by calling Magics parameter setting routines. Data may be passed in an array, in GRIB or NetCDF format
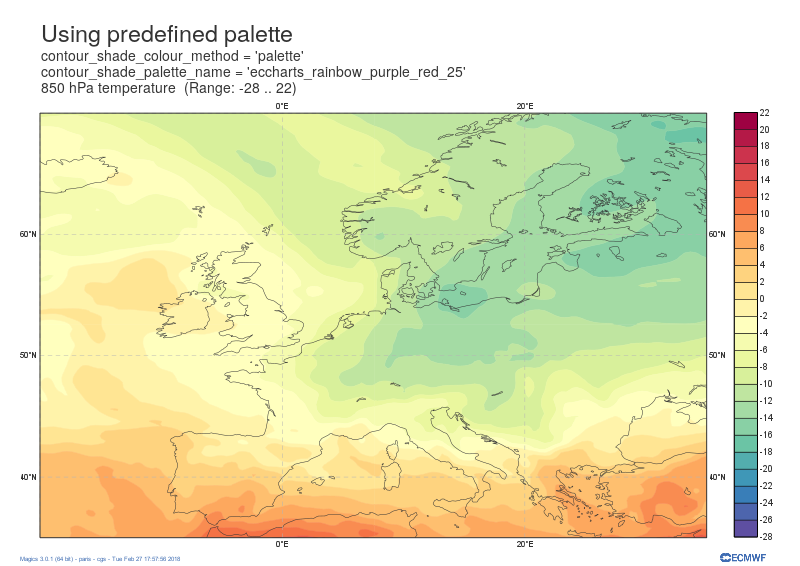
From Magics 2.0.1, Magics offers the ability of using a large variety of predefined palettes .
Have a look at the already defined palettes and do not hesitate to send us your favourites ones, we will integrate them .
#Defining the contour
contour = mcont(
    contour = 'off',
    contour_hilo = 'off',
    contour_interval = 2.0,
    contour_label = 'off',
    contour_level_selection_type = 'interval',
    contour_shade = 'on',
    contour_shade_palette_name = 'eccharts_rainbow_purple_red_25',
    contour_shade_colour_method = 'palette',
    contour_shade_max_level = 22.0,
    contour_shade_method = 'area_fill',
    contour_shade_min_level = -28.0,
    legend = 'on'
)
This version comes with a more complete implementation of the gradients colour setting.
This method can be used to create a list of colours giving a smooth transition between 2 colours.
The main control parameters of this new technique are shown in this small example.
contour_level_list = [-15,-0.5, 0.5,15]
contour_shade_colour_method = "gradients",
contour_gradients_colour_list = ['blue','white', 'red'],
contour_gradients_step_list = [50, 1, 50]
This setting will create the following list of colours : 50 colours between -15 and -0.5, 1 between -0.5 and 05 and 50 between 0.5 and 50.
![]()

New in 2.20
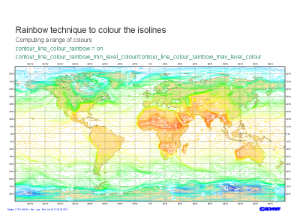
A contour_line_colour_rainbow parameter has been introduced, allowing the user to specify a different colour for each isoline.There are 2 ways to specify the list of colours to use, the setting being very similar of the colour settings for shading, ie: define the list, or let Magics computes the list given a max and min colour.
|
contour_line_colour_rainbow mcont(contour_level_selection_type = "interval", contour_line_colour_rainbow_max_level_colour = "red", contour_line_colour_rainbow = "on", contour_highlight = "off", contour_line_colour_rainbow_direction = "clockwise", contour_line_colour_rainbow_min_level_colour = "blue", contour_line_colour_rainbow_method = "calculate", contour_interval = 1.00) |
|---|
A contour_automatic_setting parameter has also been introduced, if set to ecchart, Magics will try to match the parameter with one of the predefined ecChart style. In one is found all the other contour parameters setiings will be ignored.
|
contour_automatic_setting mcont(contour_automatic_setting = "ecchart") |
|---|

9 Comments
Martin Janoušek
I believe contour_hilo_height key is missing in this documentation page.
Dominique Lucas
Where can I find which markers correspond to the different indices for contour_grid_value_marker_index? The metview doc also refers to this page.
Sylvie Lamy-Thepaut
The naming convention for marker is the same than for symbol plotting . The list of symbols can be found in the Symbol Documentation.
Dominique Lucas
Thanks. When trying the link, I get back to the confluence 'dashboard', not to the expected page?
Sylvie Lamy-Thepaut
Sorry, I typed it wrong .. must be better now
Dominique Lucas
Merci!
Nicole Girardot
Does the option contour_hilo_plot_value still exist ?
Nicole.
Sylvie Lamy-Thepaut
I am not sure that contour_hilo_plot_value was an option in magics6, but I think..
contour_hilo = 'on
contour_hilo_type = 'number'
.. Should do what you want..
Happy new Year!
Sylvie
Unknown User (scq)
I try to use "contour_hilo_position_file_name" to obtain a file (geopoint) with high or low positions, value in a file. Thanks