Importing and Plotting a GRIB file
When you first start Metview, you will see something like this:

This sort of window is called a Metview desktop.
To get started, copy a GRIB data file into your Metview directory (~/metview); if you are attending the training course at ECMWF, then you should carefully type the following command in a terminal window:
cp ~trx/mv_data/t1000.grb $HOME/metview/training/day_1
If you navigate Metview to the training/day_1 you should now see a new GRIB icon in your Metview window:
![]()
If it does not appear immediately, press F5 (or View | Reload).
Move the icon into the folder 'a simple visualisation' by dragging and dropping it there. Enter the folder and do this exercise there.
When you right-click on an icon, a context-sensitive menu appears.
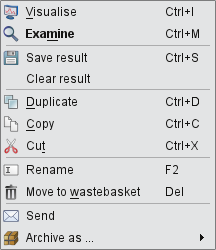
Choose examine to quickly see the structure of the GRIB file.

It contains multiple fields, each listed in the left-hand panel of the GRIB Examiner. We will look more closely at this tool later, but for now close it.
To visualise this data, right-click on its icon and select visualise. You will now see the Display Window. Its toolbars can all be moved, docked, undocked and hidden to suit your preferences.

Antialiasing

To the right of the zoom buttons should be the Antialias button. When active, a smoothing is applied to the lines in the plot – it is worth doing although it comes at the cost of a small amount of plotting speed. This setting will be remembered the next time you visualise data. Note that the antialiasing is not carried through to the various export image formats (see later) – it is active only in the interactive window.
Zooming in a Plot

The diagram to the left shows the Zoom toolbar at the top of the Display Window. Click the Zoom button to enter ‘zoom mode’. Now you can select an area by dragging with the left mouse button. You can zoom in as many times as you like. In order to ‘undo’ or ‘redo’ a zoom, click the Zoom out or Zoom in buttons respectively. The Zoom stack provides quick visual access to the current zoom history. Notice that when a new area is selected, the contours are recalculated - you see more detail as you zoom into a smaller area; you may also see more detailed coastlines.
Using the Magnifier

The Magnifier button in the toolbar toggles the magnifier tool on and off. Unlike Zoom, this is a purely graphical enlargement of the plot. It is used mainly to inspect small text such as contour labels. The magnifying glass can be moved and resized using the mouse, and the magnification scale on its left-hand side can also be adjusted.

Animation Steps

The Frames tab to the right of the plot shows the set of fields contained in the GRIB file. You can move between fields by clicking within this tab, by using the animation control buttons or by using the cursor keys. Note that each plot is computed only when you select a field. Generated plots are cached, indicated in the Frames tab through shading. This can quicken their rendering when the plots are complex. Note that modifying the plot in any way (such as zooming) clears the cache.
Layer Meta-data
There are three tabs in this panel - Frames, Layers and Data. We will look at Layers soon, but for now select the Data tab.
This reveals a page of meta-data for the current layer, including a histogram.
We will investigate these features in more detail later, but for now close the Display Window.

Cursor Data

The Cursor Data button in the toolbar toggles a panel which follows the mouse cursor. Click with the left mouse button to 'dock' or 'undock' this floating panel. It provides information about the data point closest to the mouse cursor.

Extra Work
Making best use of the space
The toolbar at the top of the Display Window contains controls for resizing the plot, and for hiding the sidebar panel at the right of the window. Use these to maximise the plot area.

Controlling the animation
Try the animation controls at the top of the Display Window and play with the speed settings.
