
This icon is a plotting specification for average (zonal or meridional) cross-section plots from a suitable GRIB data source. It can also take the output from an Average Data icon as an input. In this case, a consistency check is performed between the parameters that are common to both icons.
In addition to the parameters required for the average cross section computation, this icon specifies the axis details as well as the plot positioning in the plot frame of the display window / paper sheet and the overlay of different data units in the same plot.
For further details on the role and usage of View icons in the visualisation process, please see Analysis Views.
To access the computed output values use the Average Data icon.
From Macro/Python this icon can be called as mvaverageview().
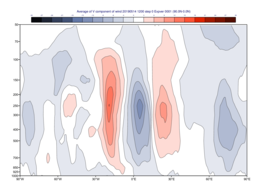
Gallery Examples using Average View
|
|
|
|


The Average View Editor
Bottom Level
Specifies the lower limit of the average cross section, as a pressure level (hPa) or model level (η levels).
Top Level
Specifies the upper limit of the average cross section, as a pressure level (hPa) or model level (η levels).
Vertical Scaling
Specifies the type of vertical axis - Linear or Logarithmic.
Interpolate Values
Specifies whether to interpolate vertically the cross-section values into a regular set of interpolated vertical levels. Choosing not to interpolate returns a cross section data matrix with values at the original levels.
Note - if you need to use the cross section data in calculations further down the stream you should not interpolate.
Area
Specifies the coordinates of the area over which the average profile is calculated. Enter coordinates (lat/long) of an area separated by a "/" (top left lat and long, bottom right lat and long). Alternatively, use the coordinate assist button.
Direction
Specifies the direction along which the averaging of the variable is performed. Options are North South and East West. For North South, the averaging is weighted by cos(latitude).
Horizontal Axis
Specifies the plotting attributes of the horizontal axis. An Axis Plotting icon can be dropped here.
Vertical Axis
Specifies the plotting attributes of the vertical axis. An Axis Plotting icon can be dropped here.
Specifies the X offset of the plot from the left side of the plot frame (any subdivision of the display area). This is expressed as a percentage of the X-dimension of the plot frame. Specifies the Y offset of the plot from the bottom side of the plot frame (any subdivision of the display area). This is expressed as a percentage of the Y-dimension of the plot frame. Specifies the X length of the plot. This is expressed as a percentage of the X-dimension of the plot frame. Hence the sum of this X length plus the X offset cannot exceed 100 (it is advised that it does not exceed 95 since you need some margin on the right for things like axis or map grid labels). As above but for the Y length of the plot. Toggles the plotting of a border line around the plot frame On /Off . Comprising Page Frame Colour, Page Frame Line Style and Page Frame Thickness, these parameters specify the characteristics of the plot frame border line. Only available when Page Frame is On . Toggles the plotting of plot identification line On /Off . Specifies user text to be added to the plot identification line. Only available when Page Id Line is On . Toggles the plotting of a border line around the plot itself On /Off . In most cases you will want this to be left On . When Off the sides of the plot not equipped with axis will not be plotted. Comprising Subpage Frame Colour, Subpage Frame Line Style and Subpage Frame Thickness, these parameters specify the characteristics of the plot frame border line. Only available when Subpage Frame is On . Specifies the colour of the background of the plot (i.e. not affected by visual definitions like contour shadings or lines). Subpage X Position
Subpage Y Position
Subpage X Length
Subpage Y Length
Page Frame
Page Frame Parameters
Page Id Line
Page Id Line User Text
Subpage Frame
Subpage Frame Parameters
Subpage Background Colour