Download source and data
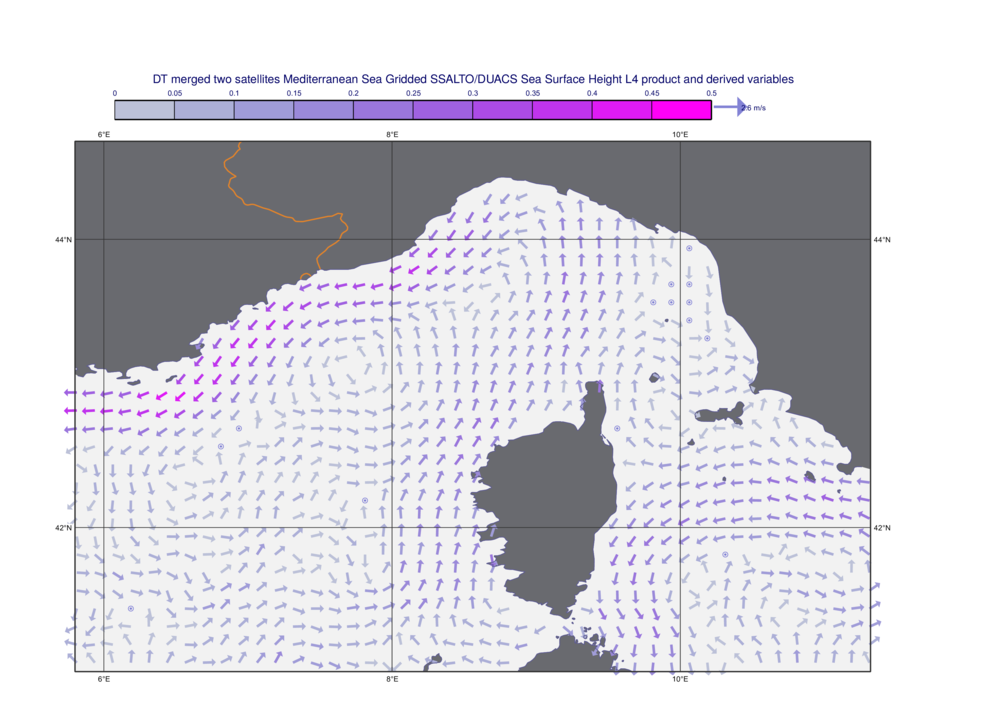
NetCDF Sea Currents with Fix-sized Vectors Example
#Metview Macro

#  **************************** LICENSE START ***********************************
#
#  Copyright 2019 ECMWF. This software is distributed under the terms
#  of the Apache License version 2.0. In applying this license, ECMWF does not
#  waive the privileges and immunities granted to it by virtue of its status as
#  an Intergovernmental Organization or submit itself to any jurisdiction.
#
#  ***************************** LICENSE END ************************************
#

# read NetCDF file with gridded data over the Mediterranean Sea
nc = read("sea_current.nc")

# this NetCDF data has the following structure:

# dimensions:
#	time = 1 ;
#	latitude = 128 ;
#	longitude = 344 ;
#	nv = 2 ;
# variables:
#   float time(time) ;
#	float latitude(latitude) ;
#	float longitude(longitude) ;
#   int ugos(time, latitude, longitude) ;
#		ugos:long_name = "Absolute geostrophic velocity: zonal component" ;
#	int vgos(time, latitude, longitude) ;
#		vgos:long_name = "Absolute geostrophic velocity: meridian component" ;


# define netcdf plotting based on the data structure above
vis = netcdf_visualiser(
    netcdf_plot_type            : "geo_matrix_vectors",
    netcdf_latitude_variable    : "latitude",
    netcdf_longitude_variable   : "longitude",
    netcdf_x_component_variable : "ugos",
    netcdf_y_component_variable : "vgos",
    netcdf_data                 : nc
    )

# define vector plotting using fix-sized arrow
vector_plotting = mwind(
    wind_thinning_factor                  : 1,
    legend                                : "on",
    wind_advanced_method                  : "on",
    wind_advanced_colour_max_value        : 0.5,
    wind_advanced_colour_min_value        : 0,
    wind_advanced_colour_max_level_colour : "RGB(1,0.003922,0.9668)",
    wind_advanced_colour_min_level_colour : "RGB(0.7359,0.7584,0.8484)",
    wind_arrow_calm_indicator             : "on",
    wind_arrow_calm_below                 : 0.01,
    wind_arrow_colour                     :'RGB(0.5124,0.5124,0.8366)',
    wind_arrow_head_shape                 : 1,
    wind_arrow_head_ratio                 : 1,
    wind_arrow_fixed_velocity             : 1,
    wind_arrow_thickness                  : 2,
    wind_arrow_unit_velocity              : 2.6
    )


# define coastlines
coastlines = mcoast(
    map_coastline_colour            : "RGB(0.3628,0.3557,0.5698)",
    map_coastline_land_shade        : "on",
    map_coastline_land_shade_colour : "RGB(0.4119,0.4173,0.4352)",
    map_coastline_sea_shade         : "on",
    map_coastline_sea_shade_colour  : "RGB(0.95,0.95,0.95)",
    map_boundaries                  : "on",
    map_boundaries_colour           : "RGB(0.8809,0.5136,0.1701)",
    map_boundaries_thickness        : 2,
    map_grid_colour                 : "charcoal",
    map_grid_latitude_increment     : 2,
    map_grid_longitude_increment    : 2
    )


# define map view
view = geoview(
    map_area_definition : "corners",
    area                : [41,5.8,44.68,11.32],
    coastlines: coastlines
    )

# define title
title = mtext(text_font_size : 0.4)

# define legend
legend = mlegend(legend_text_font_size : 0.25)

# define output
setoutput(pdf_output(output_name : 'nc_seacurrent_fixed_vector'))

# generate plot
plot(view, vis, vector_plotting, legend, title)
NetCDF Sea Currents with Fix-sized Vectors Example
#Metview Macro

#  **************************** LICENSE START ***********************************
#
#  Copyright 2019 ECMWF. This software is distributed under the terms
#  of the Apache License version 2.0. In applying this license, ECMWF does not
#  waive the privileges and immunities granted to it by virtue of its status as
#  an Intergovernmental Organization or submit itself to any jurisdiction.
#
#  ***************************** LICENSE END ************************************
#

import metview as mv

# read NetCDF file with gridded data over the Mediterranean Sea
nc = mv.read("sea_current.nc")

# this NetCDF data has the following structure:

# dimensions:
#	time = 1 ;
#	latitude = 128 ;
#	longitude = 344 ;
#	nv = 2 ;
# variables:
#   float time(time) ;
#	float latitude(latitude) ;
#	float longitude(longitude) ;
#   int ugos(time, latitude, longitude) ;
#		ugos:long_name = "Absolute geostrophic velocity: zonal component" ;
#	int vgos(time, latitude, longitude) ;
#		vgos:long_name = "Absolute geostrophic velocity: meridian component" ;


# define netcdf plotting based on the data structure above
vis = mv.netcdf_visualiser(
    netcdf_plot_type            = "geo_matrix_vectors",
    netcdf_latitude_variable    = "latitude",
    netcdf_longitude_variable   = "longitude",
    netcdf_x_component_variable = "ugos",
    netcdf_y_component_variable = "vgos",
    netcdf_data                 = nc
    )

# define vector plotting using fix-sized arrow
vector_plotting = mv.mwind(
    wind_thinning_factor                  = 1,
    legend                                = "on",
    wind_advanced_method                  = "on",
    wind_advanced_colour_max_value        = 0.5,
    wind_advanced_colour_min_value        = 0,
    wind_advanced_colour_max_level_colour = "RGB(1,0.003922,0.9668)",
    wind_advanced_colour_min_level_colour = "RGB(0.7359,0.7584,0.8484)",
    wind_arrow_calm_indicator             = "on",
    wind_arrow_calm_below                 = 0.01,
    wind_arrow_colour                     ='RGB(0.5124,0.5124,0.8366)',
    wind_arrow_head_shape                 = 1,
    wind_arrow_head_ratio                 = 1,
    wind_arrow_fixed_velocity             = 1,
    wind_arrow_thickness                  = 2,
    wind_arrow_unit_velocity              = 2.6
    )


# define coastlines
coastlines = mv.mcoast(
    map_coastline_colour            = "RGB(0.3628,0.3557,0.5698)",
    map_coastline_land_shade        = "on",
    map_coastline_land_shade_colour = "RGB(0.4119,0.4173,0.4352)",
    map_coastline_sea_shade         = "on",
    map_coastline_sea_shade_colour  = "RGB(0.95,0.95,0.95)",
    map_boundaries                  = "on",
    map_boundaries_colour           = "RGB(0.8809,0.5136,0.1701)",
    map_boundaries_thickness        = 2,
    map_grid_colour                 = "charcoal",
    map_grid_latitude_increment     = 2,
    map_grid_longitude_increment    = 2
    )


# define map view
view = mv.geoview(
    map_area_definition = "corners",
    area                = [41,5.8,44.68,11.32],
    coastlines          = coastlines
    )

# define title
title = mv.mtext(text_font_size = 0.4)

# define legend
legend = mv.mlegend(legend_text_font_size = 0.25)

# define output
mv.setoutput(mv.pdf_output(output_name = 'nc_seacurrent_fixed_vector'))

# generate plot
mv.plot(view, vis, vector_plotting, legend, title)